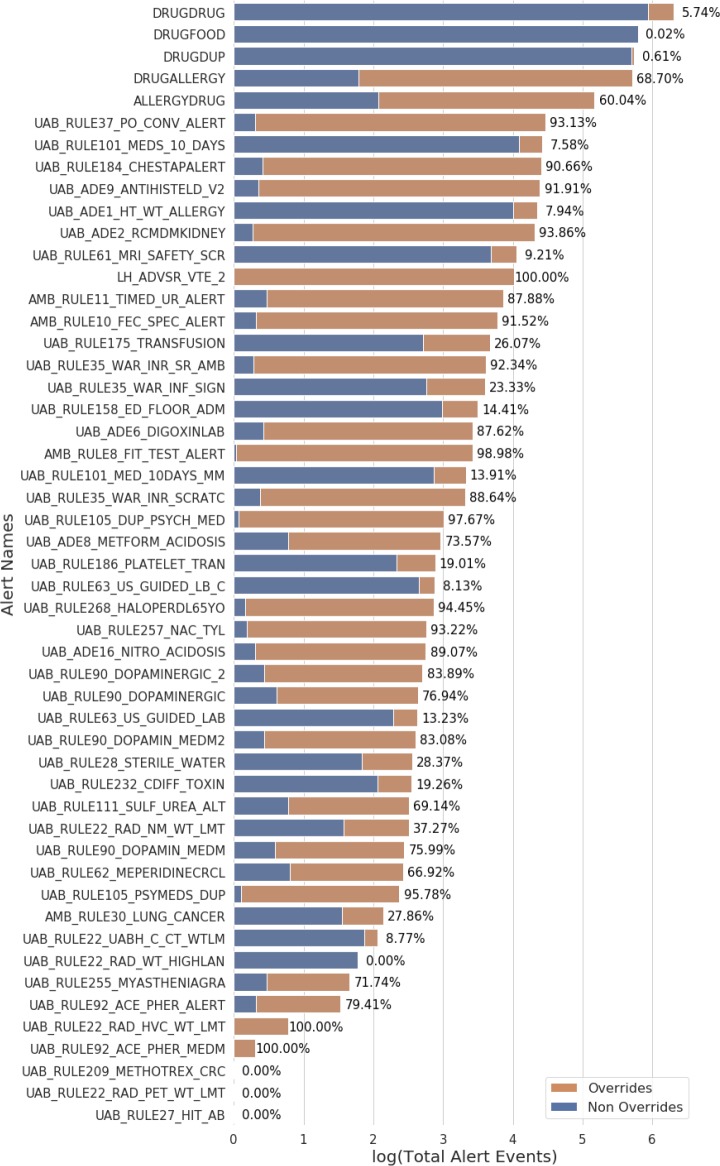
Figure 1.
The distribution of alert events in the UAB EHR broken down by override status. Alert rules were limited to those that provided clinicians an override option. The length of the bars indicates the log transformed number of the total alert events triggered by the alert rule on the y-axis. The two colors of the bar reflect the ratio of overridden to non-overridden alert events (alerts events that clinicians chose the alternative option to overriding) with the percentage of each alert rule’s overrides displayed to the right of the bar. Many of these alerts have override rates above 70% showing that the UAB institution has similar override rates to the 49 – 96% reported by other institutions.

