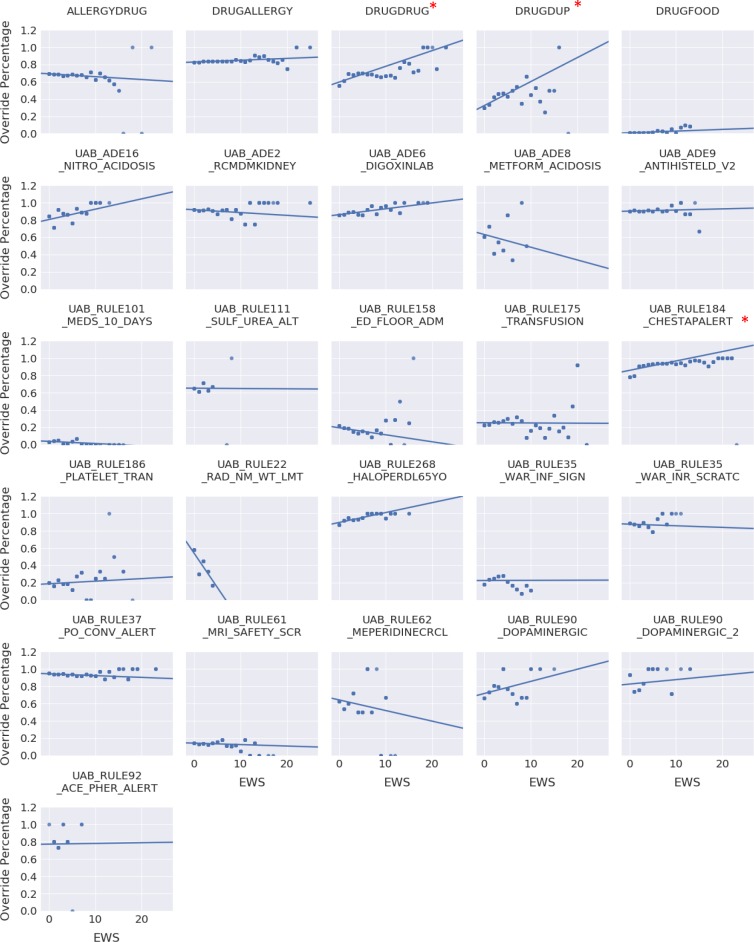
Figure 2.
The effect of EWS on the override frequency of the 26 alerts analyzed by logistic regression with GEE. Override frequency per alert per EWS level was calculated and plotted with an estimated line using simple linear regression. Each data point for a specific EWS and override frequency was duplicated to reflect the number of alert events and weight the information. Thus, the trend lines indicate whether an alert is more or less likely to be overridden with deteriorating patient status. The asterisks indicate alerts in which EWS is a significant predictor of alert overrides. Other alerts have some increase or decrease in override frequency with an increasing EWS suggesting that patient status might play a small part in their override likelihood

