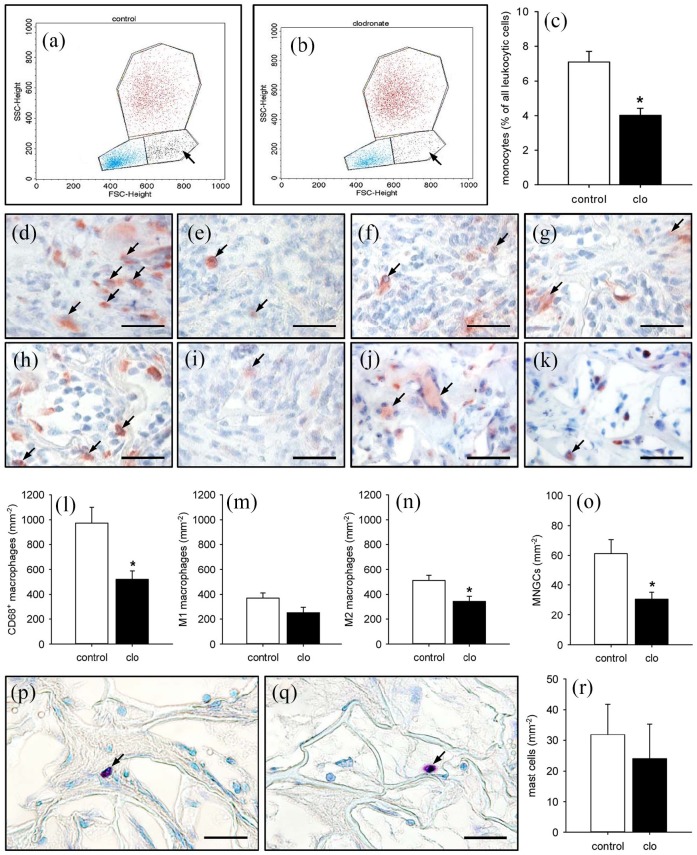
Figure 7.
Systemic and implant-associated immune cells in PBS- and clo-treated animals. (a, b) Flow cytometric histograms showing the leukocyte population divided into lymphocytic (blue), monocytic (black; arrows), and granulocytic (red) subpopulations within lysed whole blood of PBS- (a) and clo-treated (b) C57BL/6 mice 14 days after matrix implantation. (c) Monocytes (% of all leukocytic cells) within the blood of PBS- (control; white bar; n = 8) and clo-treated (black bar; n = 8) mice. Means ± SEM. *p < 0.05 vs control. (d–k) Immunohistochemical detection of CD68+ macrophages (d, e; arrows), M1 macrophages (f, g; arrows), M2 macrophages (h, i; arrows), and MNGCs (j, k; arrows) within MVF-seeded matrices of PBS- (d, f, h, j) and clo-treated (e, g, i, k) mice. Scale bars: 30 µm. (l–o) CD68+ macrophages (l; mm−2), M1 macrophages (m; mm−2), M2 macrophages (n; mm−2), and MNGCs (o; mm−2) within MVF-seeded matrices in PBS- (control; white bars; n = 8) and clo-treated (black bars; n = 8) mice. Means ± SEM. *p < 0.05 vs control. (p, q) Toluidine blue–stained sections showing mast cells (arrows) within MVF-seeded matrices of a PBS- (p) and a clo-treated (q) mouse. Scale bars: 30 µm. (r) Mast cells (mm−2) within MVF-seeded matrices of PBS- (control; white bar; n = 8) and clo-treated (black bar; n = 8) mice. Means ± SEM.

