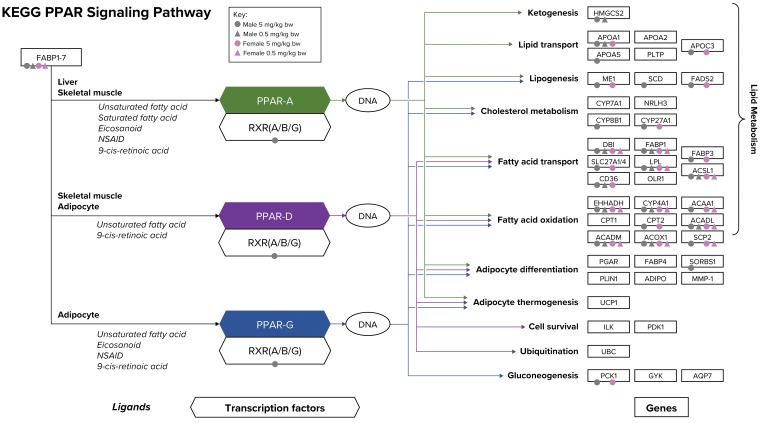
Figure 3.
The PPAR signaling network. Ligands, transcription factors, and genes as related to PPAR α/δ/γ signaling are shown according to the KEGG database. Individual genes that are significantly differentially expressed in the present study are notated by color-coded shapes according to sex (males = gray, females = pink) and concentration (5 mg/kg bw/d = circles, 0.5 mg/kg bw/d = triangles). Arrows corresponding to each PPAR family member show the target genes for that family member (α/δ/γ): green = PPARα, purple = PPARδ, and blue = PPARγ. Bw indicates body weight; KEGG, Kyoto Encyclopedia of Genes and Genomes; PPAR, peroxisome proliferator-activated receptor.

