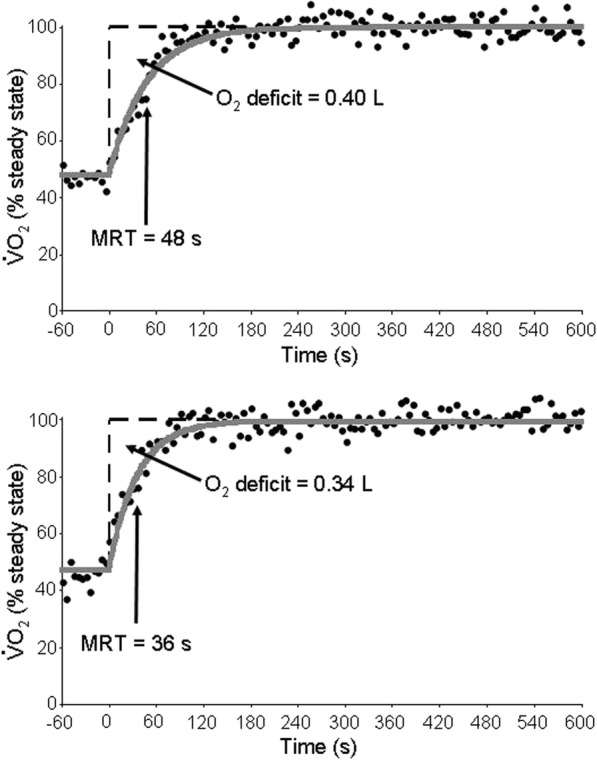
Fig. 2.

Rate of pulmonary oxygen uptake for a representative subject in the O2+ group before (top panel) and after (bottom panel) an eight-week training intervention comprising HIIT performed twice per week. The data were collected during unloaded cycling (time = − 60 to 0 s) followed by a square-wave increase to 30% of the subject’s peak work rate. Closed circles depict 5-s averages of breath-by-breath V̇O2 data while solid line depicts modelled fit. Notice the marked reduction in the V̇O2 MRT (i.e., the time taken for V̇O2 to reach ~ 63% of the steady-state amplitude) and consequent reduction in the O2 deficit indicated by the dashed line (O2 deficit = MRT x Amplitude)
