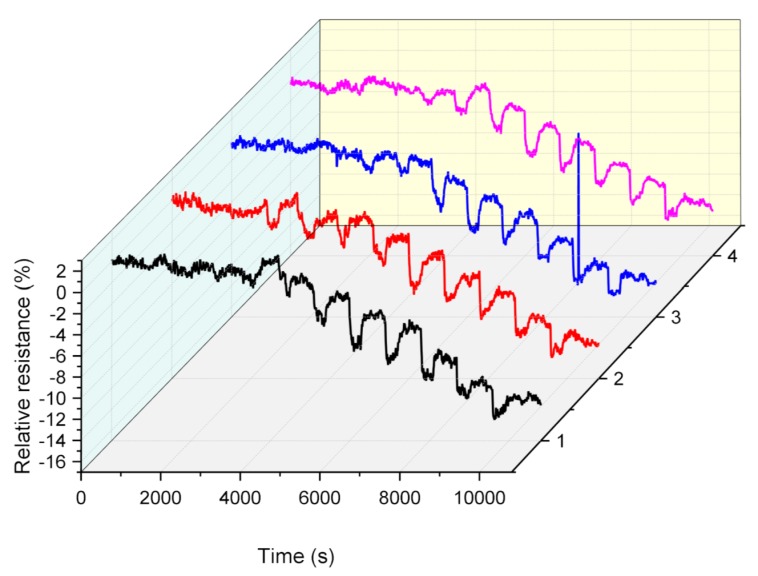
Figure 12.
The dynamic responses of four different s6DNA-SWNTs exposed to different concentrations (0, 0.25, 0.5, 1.0, 2.5, 5, 10, 20, 40, 60, 80 and 100) of 4-ethyl phenol vapor for 5 min and flow air for 10 min at intervals. (VDS = 0.1 V and VG = 0 V; each concentration exposed for 5 min and point calculated by the average value of four different gas biosensors).

