
Figure 1.
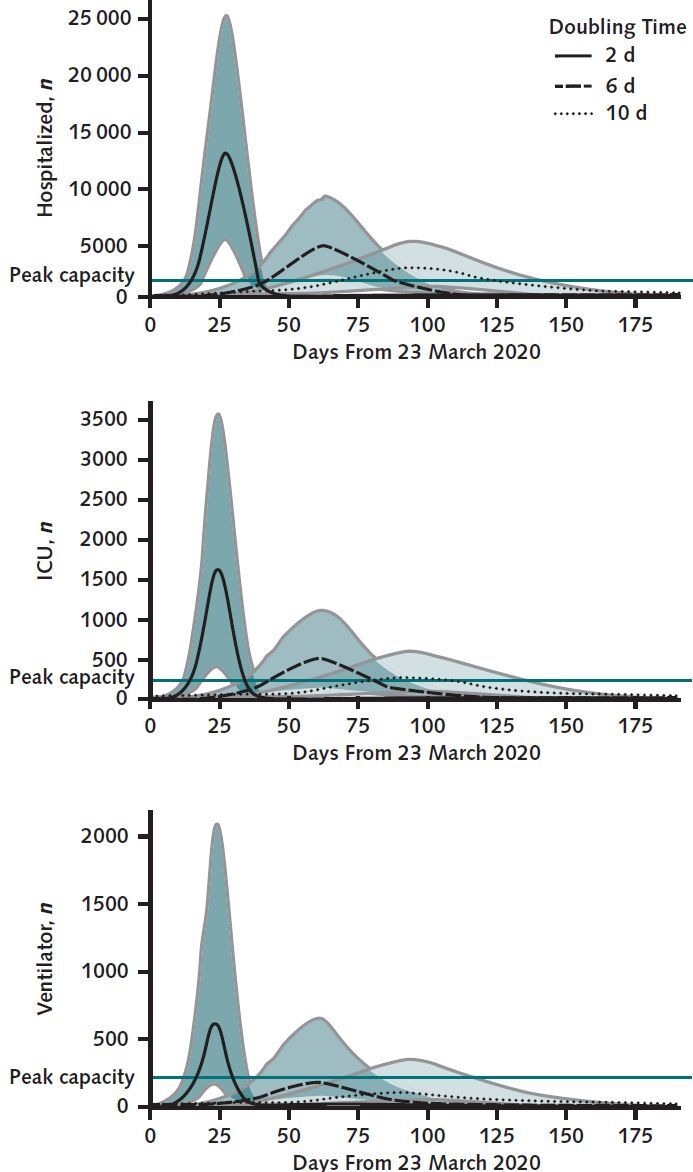
Projected daily total hospital census (top), intensive care unit ICU census (middle), and patients requiring invasive mechanical ventilation (bottom) for patients with COVID-19.
Shaded regions represent 2.5% and 97.5% percentiles across 1000 simulations representing upper and lower bounds on likely scenarios. The gray horizontal lines indicate current health system capacity. ICU = intensive care unit.