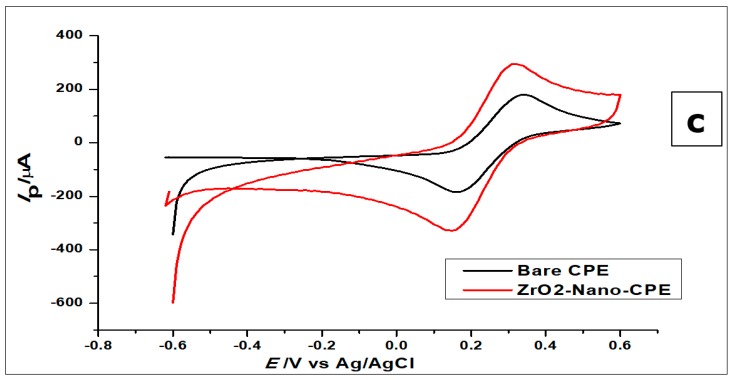
Figure 5.
(a) Cyclic voltammograms of 1 × 10⁻² mol L−1 GA at ZrO2 nanoparticles-modified CPE, bare CPE and bare glassy carbon electrode (GCE) in 0.1 mol L−1 phosphate buffer of pH 2.0 at a scan rate of 100 mVs−1 (b) Nyquist plot representing the EIS measurement of 5mmol L−1 using the bare CPE and ZrO2 nanoparticles (inset) The equivalent circuit showing resistors and capacitor (c) The cyclic voltammograms of 1.0 × 10⁻³ mol L− [Fe(CN)6]3−/4− redox solution, using bare CPE and ZrO2 nanoparticles-modified CPE.


