. 2020 Apr;8(2):150–163. doi: 10.30476/IJCBNM.2020.82278.1049
Copyright: © International Journal of Community Based Nursing and Midwifery
This is an open-access article distributed under the terms of the Creative Commons Attribution-Noncommercial-Share Alike 4.0 Unported, which permits unrestricted use, distribution, and reproduction in any medium, provided the original work is properly cited.
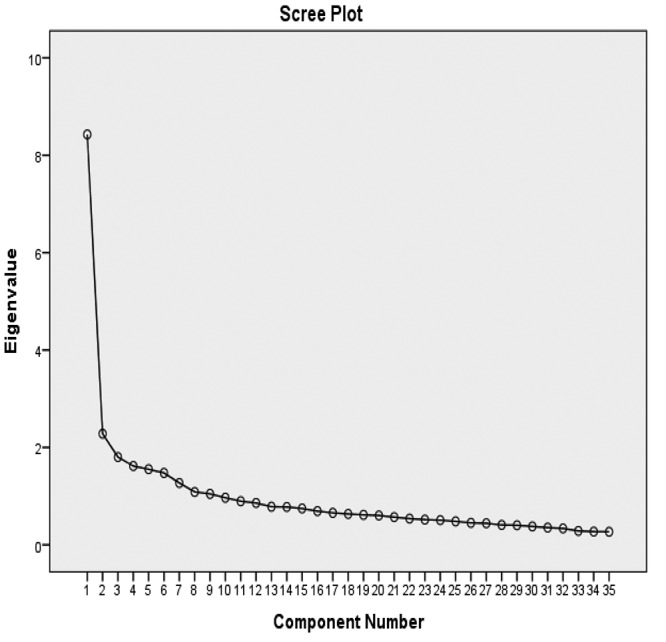
Figure 2.

Scree plot
