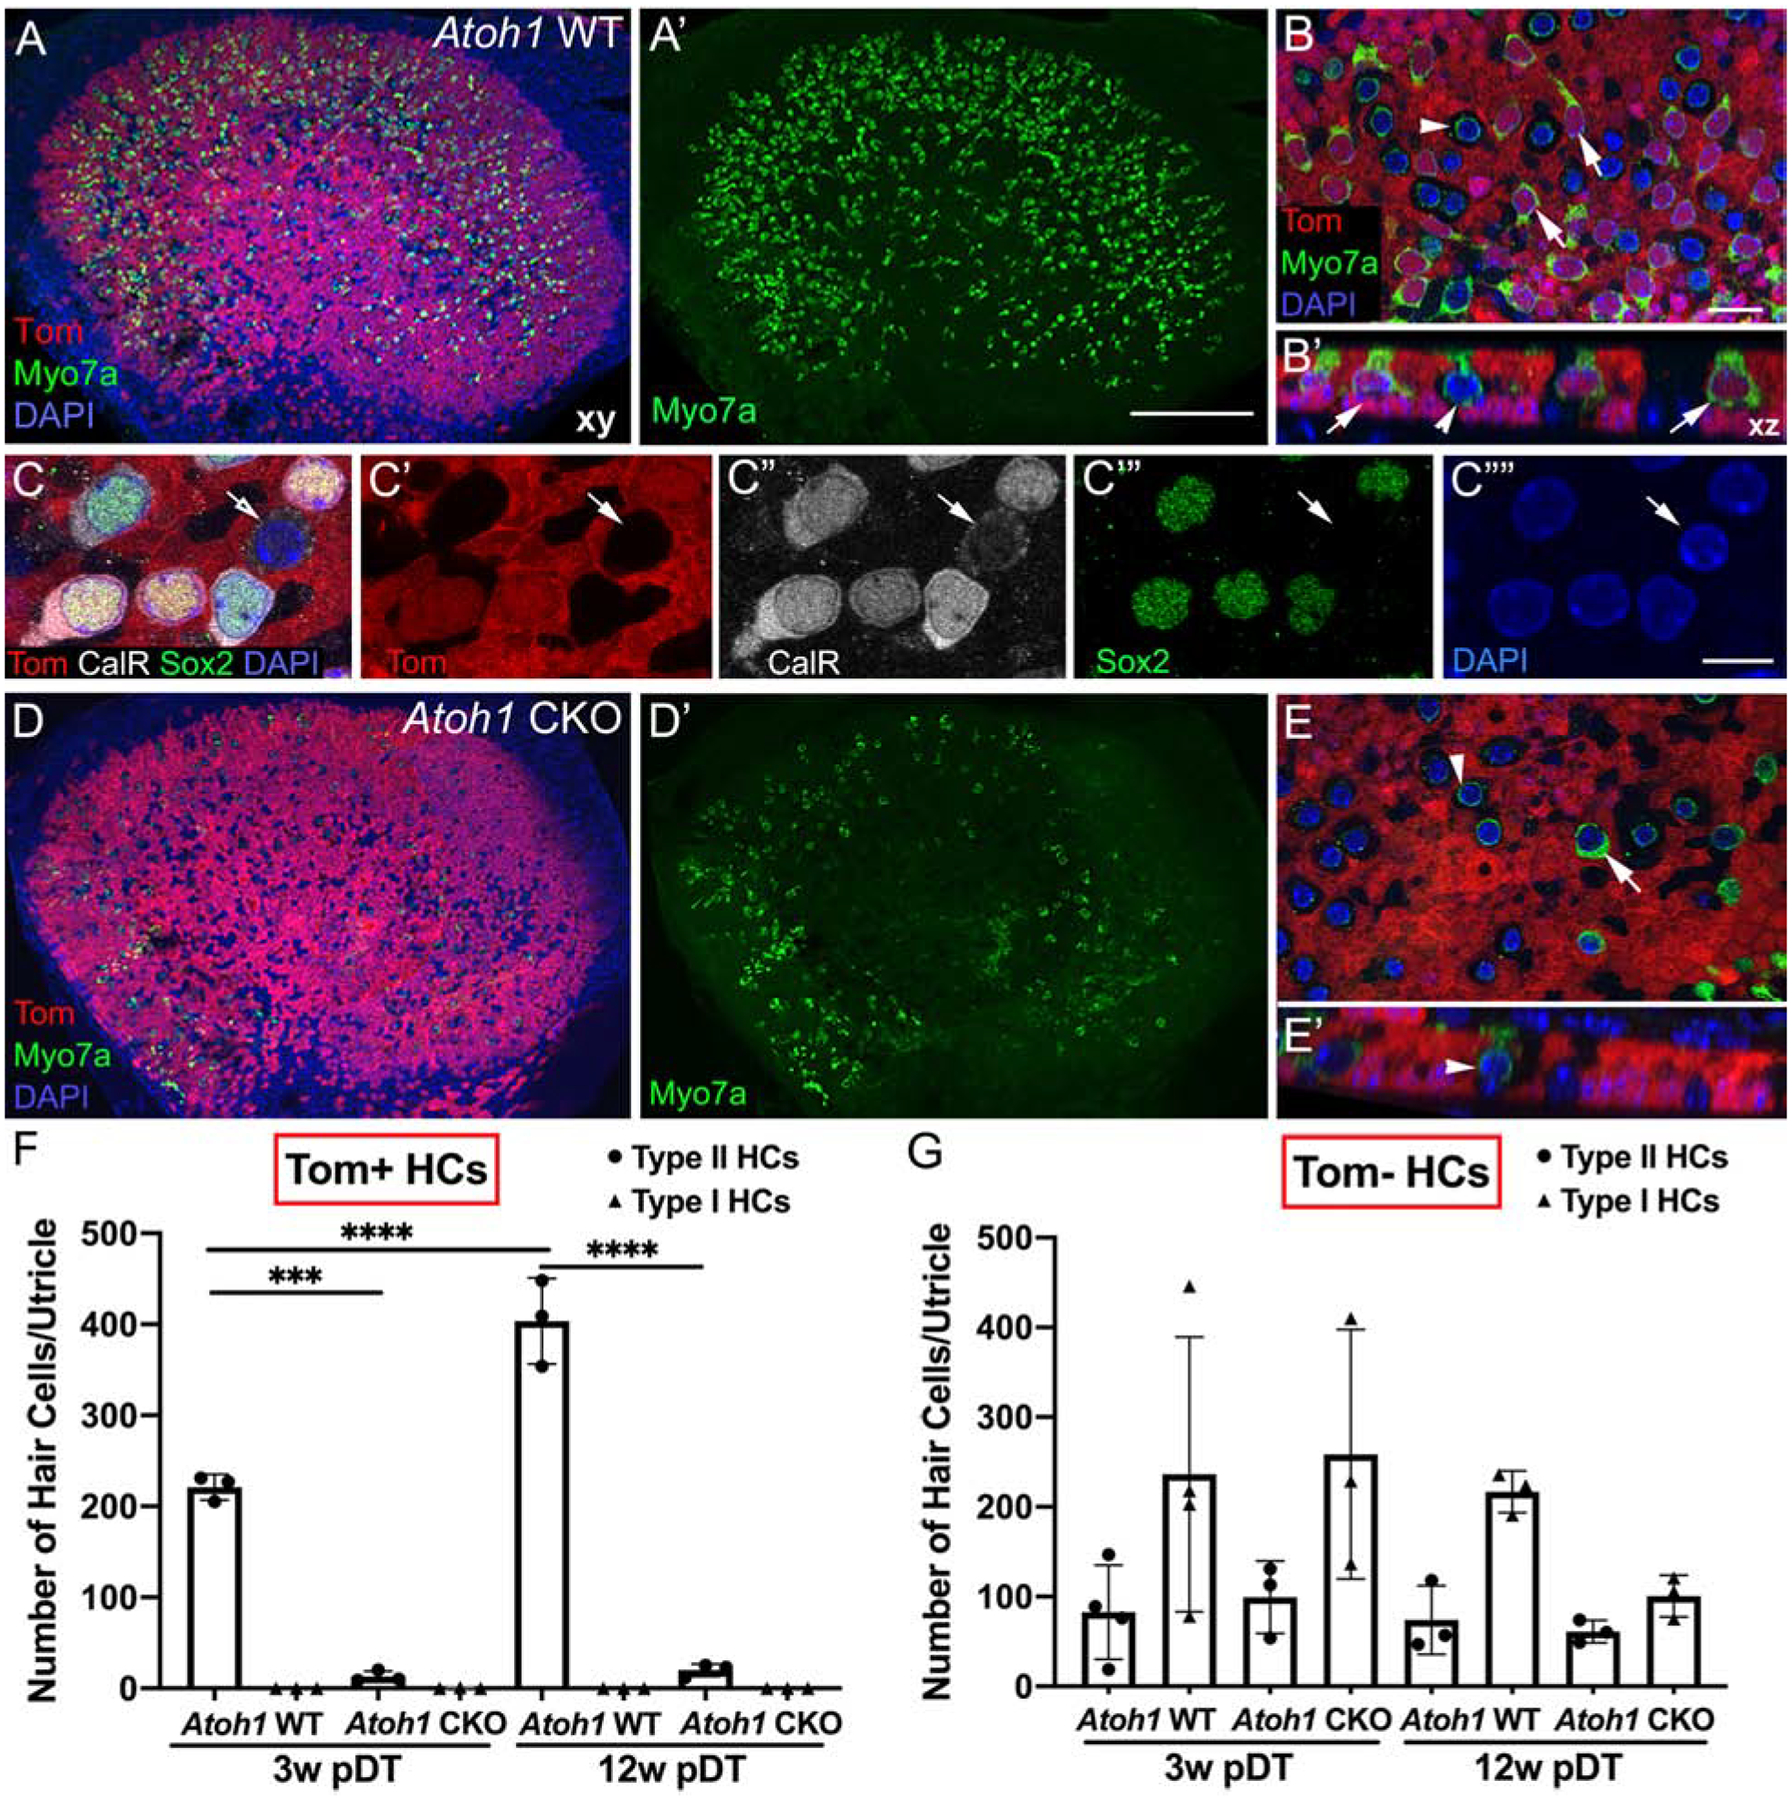
Figure 2. Atoh1 is required in supporting cells for regeneration of type II hair cells in the adult utricle.

A. Representative low-magnification horizontal (xy) confocal slice of a whole-mount utricle from an Atoh1 WT mouse at 3 weeks post-DT (pDT) and labeled for myosin VIIa (Myo7a, green), tdTomato (red), and DAPI (blue). A’. Same field as A, showing Myo7a labeling only. B. High-magnification xy view of the lateral extrastriolar region of the sensory epithelium from an Atoh1 WT utricle. B’. Optical cross-section from a region taken from B. Arrows point to tdTomato-positive type II hair cells and the arrowhead points to a tdTomato-negative type I hair cell. C-C””. Representative high-magnification xy images of several regenerated type II hair cells, labeled with antibodies to calretinin (CalR, white, labeled nucleus and cytoplasm), Sox2 (green, labeled nucleus), tdTomato (Tom, red), and DAPI (blue, labeled nuclei). Panels C’-C”” show each label individually. Arrows point to the only type I-like hair cell (tdTomato-negative) in the field. D. Representative low-magnification xy confocal slice of a whole-mount utricle from an Atoh1 CKO mouse at 3 weeks pDT and labeled for Myo7a (green), tdTomato (red), and DAPI (blue). D’. Same field as D, showing Myo7a labeling only. E. Representative high-magnification xy view of the lateral extrastriolar region of the sensory epithelium from an Atoh1 CKO utricle. E’. Optical cross-section from a region taken from E. The arrowhead points to a tdTomato-negative type I hair cell, and the arrow points to a tdTomato-negative type II hair cell. F,G. Graphs showing the average number of type I and type II hair cells per utricle that are either tdTomato-positive (Tom+, F) or tdTomato-negative (Tom-, G). Arrows point to groups with average values of 0. Horizontal lines over bars and asterisks indicate significant difference from control (one-way ANOVA with Tukey’s multicomparisons test). Error bars represent +1 standard deviation. N = 3–4 mice per group. Scale bar in A’ = 150 μm and applies to A,A’D,D’. Scale bar in C”” = 6 μm and applies to C-C””. Scale bar in B = 12 μm and applies to B,B’,E,E’.
