
Figure 4. Deletion of Atoh1 from supporting cells does not appear to alter supporting cell nuclear shape or number.
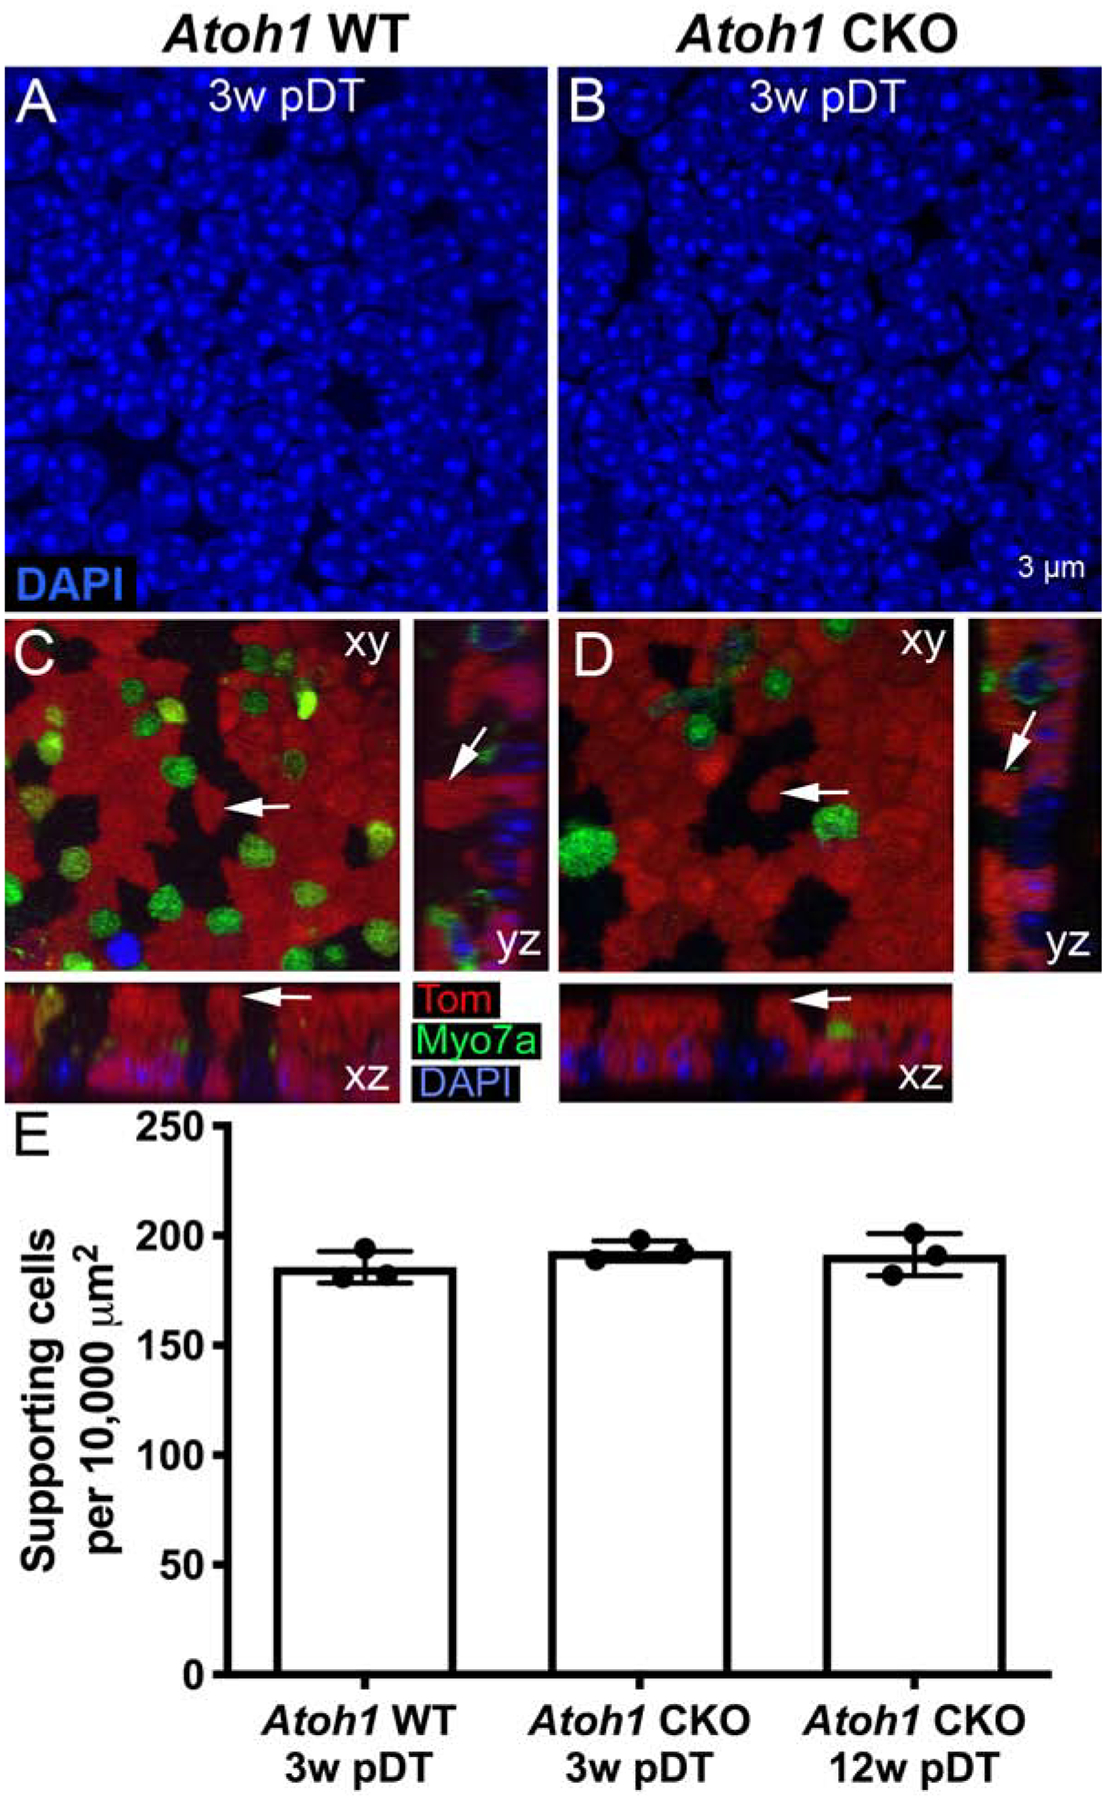
A,B. Representative high-magnification horizontal (xy) confocal slices of the supporting cell nuclear layer from whole-mount utricles from an Atoh1 WT mouse (A) and an Atoh1 CKO mouse (B) at 3 weeks post-DT (pDT) that were labeled with DAPI (blue). C,D. Representative images of the utricular sensory epithelium, showing a top-down view (xy) and two orthogonal slices (yz and xz), to illustrate the shape of supporting cells from Atoh1 WT (C) and Atoh1 CKO (D) mice. The arrows in C and D point to the same cell in each type of view. In the xz slices, supporting cell nuclei are toward the bottom, and in the yz slices, supporting cell nuclei are toward the right. E. Graph showing the number of utricular supporting cell nuclei per 10,000 μm2 from Atoh1 WT and Atoh1 CKO mice. Error bars represent +1 standard deviation. N = 3 mice per group. Scale bar in B applies to A and B.