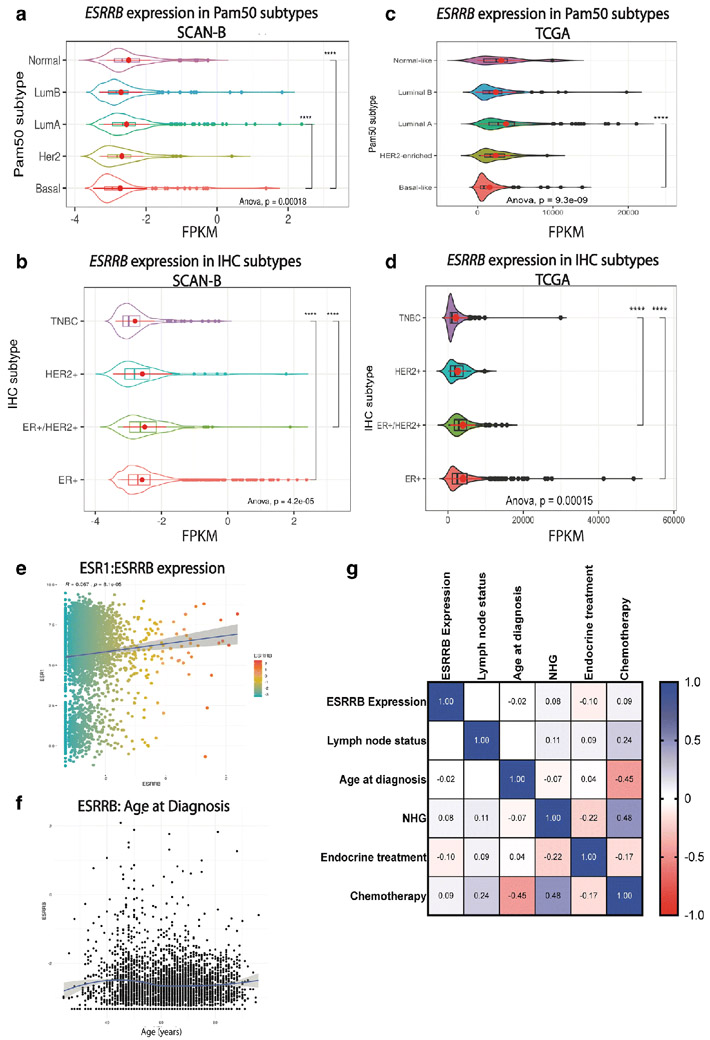
Fig. 2. ESRRB mRNA expression in SCAN-B and TCGA data sets.
Analysis of RNAseq data from SCAN-B (a, b, e, f, g) and TCGA (c, d) data. Kruskal-Wallis one-way ANOVA and Tukey multiple comparisons of means with 95% family-wise confidence level. a-d. ESRRB mRNA FPKM levels by PAM50 subtype in SCAN-B (a) and TCGA (c) data. ESRRB mRNA levels by IHC subtype in SCAN-B (b) and TCGA (d) data. Shown as mean ± standard deviation, p < 0.0001 **** (e- g.) Correlations in SCAN-B dataset. e. Correlation of ESR1 to ESRRB mRNA expression f. ESRRB mRNA expression by age g. Correlation of ESRRB high and low expression, frequency of node status, age at diagnosis, NHG, endocrine treatment, and chemotherapy in all breast cancer patients in dataset. Spearman correlation. White spaces were not significantly different. Light to dark colors, correlation observed and statistically significant, p< 0.001

