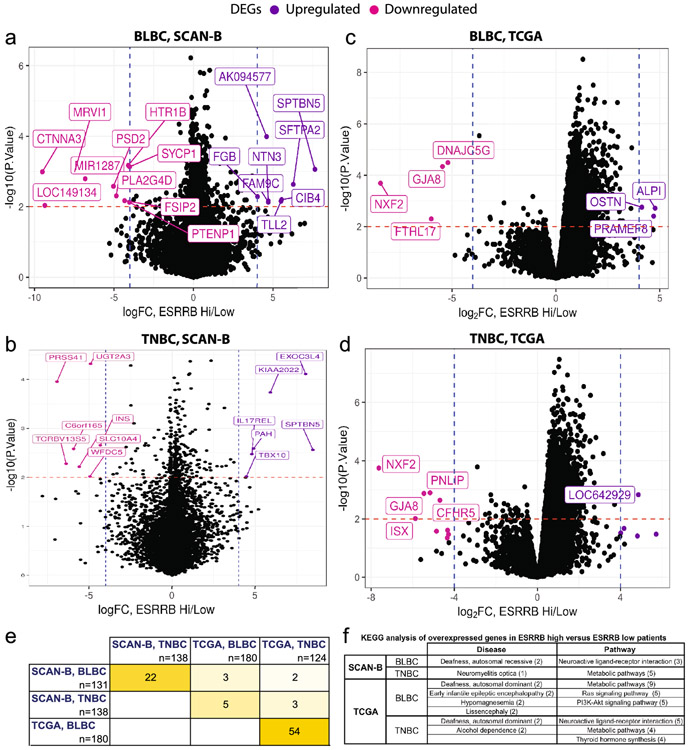
Fig. 4. Differentially expressed genes (DEGs) associated with ESRRB expression in SCAN- and TCGA data sets.
DEG analysis in patients with BLBC (a, c) and TNBC (b, d). Shown are DEGs that are high in ESRRB high patients, and low in ESRRB high patients in SCANB data, p<0.01, fold change (FC) > 4. e. Heat map depicting DEG overlap between the four analyses shown in a-e. f. Top pathways and diseases represented by overexpressed DEGs in ESRRB high-versus- low patients.

