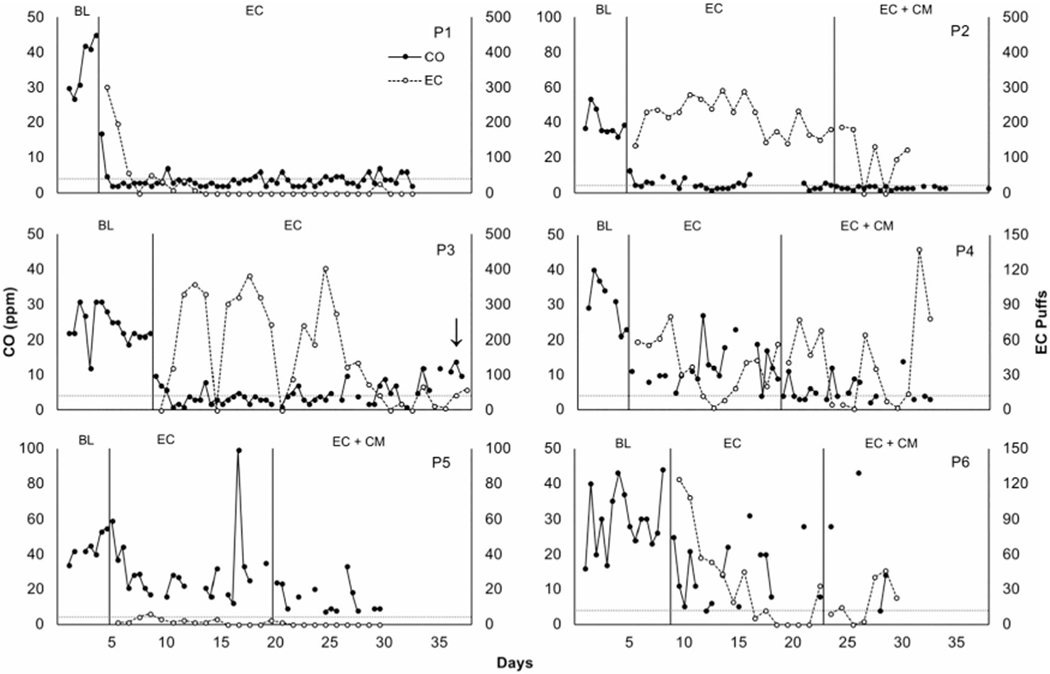
Figure 1.

Carbon monoxide (CO) levels in parts per million (filled circles, primary axis) and number of EC puffs per day (open circles, secondary axis) across phases. BL = baseline. Horizontal dashed lines represent abstaining goals (CO ≤4 ppm). Arrows indicate that a participant reported using e-liquid not provided by researchers. The first day in EC phase corresponded with the quit date. Note that two CO samples are plotted consecutively along the x-axis per day.
