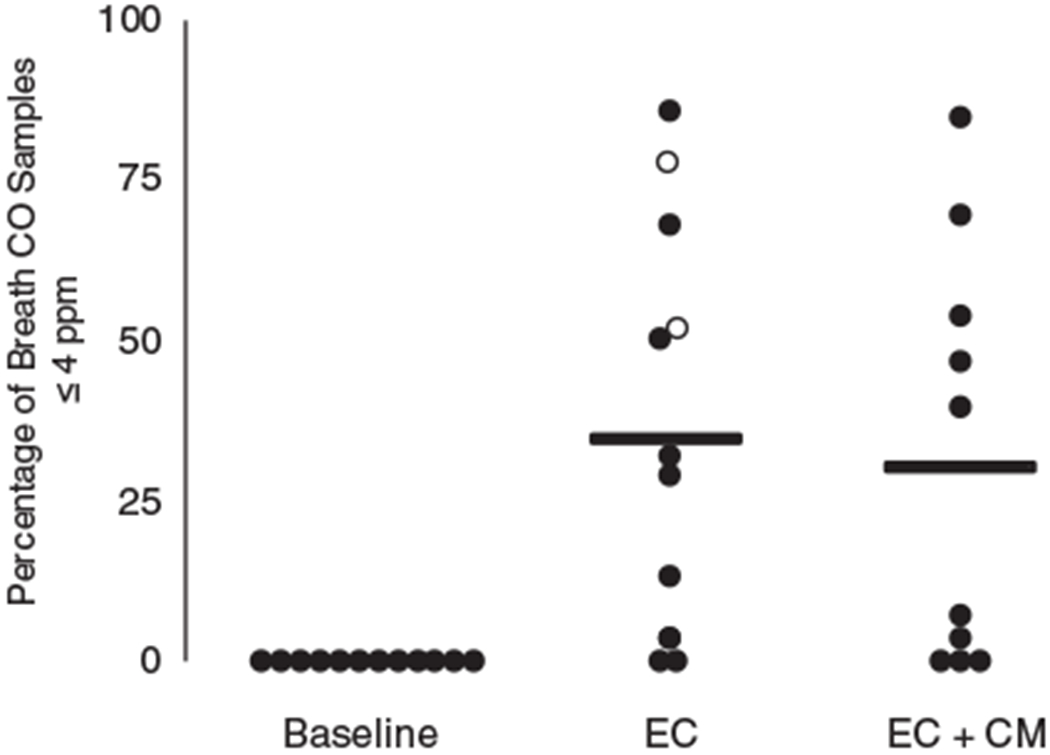
Figure 3.

Percentage of breath carbon monoxide (CO) samples that were less than or equal to abstinence criteria of 4 parts per million (ppm) across each phase. Dots represent data for each participant. Open circles represent data for participants who met abstinence criteria in EC phase and did not receive EC + CM. Horizontal lines represent means.
