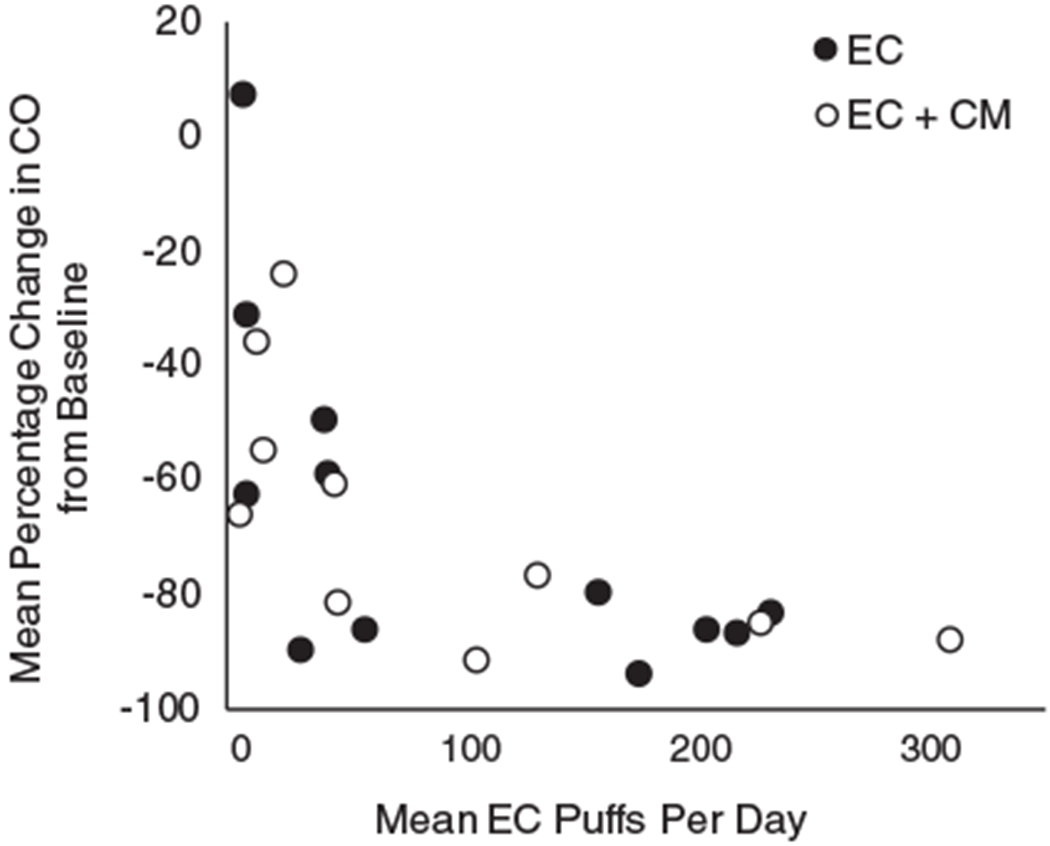
Figure 4.

Mean percentage change in breath carbon monoxide (CO) samples from baseline plotted as a function of mean EC puffs per day for each phase. Each dot represents data for a participant. Filled circles represent participants in the EC phase and open circles represent participants in the EC + CM phase.
