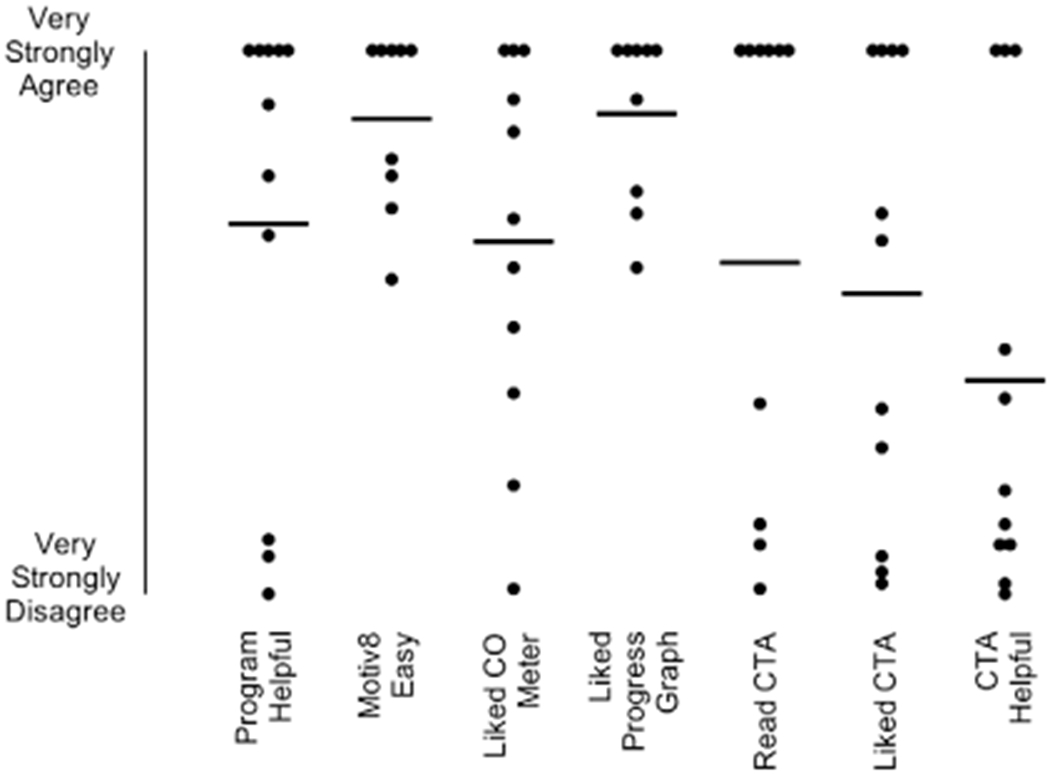
Figure 6.

Acceptability ratings for intervention procedures. Each dot represents a score for a participant. Horizontal lines represent means. Responses were provided on a visual analog scale from 0-100 (0 = Very Strongly Disagree, 100 = Very Strongly Agree). CTA = Clearing the Air.
