
Table 1.
IC50 Values of 1 Analogues in Nanomolar, Determined by Cellular Ca2+ Flux Assays in HEK-293 Cells Stably Expressing hTRPM8 and Represented as Mean ± SEM from Three Independent Experimentsa
 |
Functional Activity | |
|---|---|---|
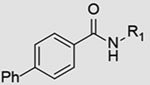
| Cmpd | R1 | hTRPM8 potcncy IC50 ± SEM |
| 1 | 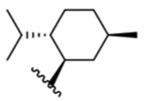 |
16 ± 1 μM |
| 2 | 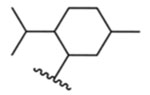 |
468 ± 1 nM |
| 3 | 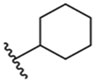 |
49 ± 1 μM |
| 4 |  |
7.1 ±0.9 μM |
| 5 |  |
52 ± 1 nM |
| 6 |  |
692 ± 1 nM |
| 7 |  |
62 ± 1 nM |
| 8 | 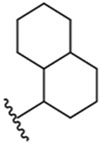 |
21 ± 1 μM |
| 9 | 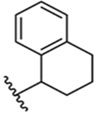 |
55 + 1 μM |
| 10 (diastereomeric mixture) | 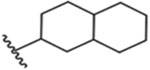 |
6± 1 nM |
| 11 | 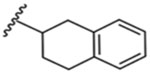 |
52 ± 1 nM |
| 12 (isolated diastereomer) |  |
1.4 ± 1.0 nM |
| 13 |  |
40 ± 1 nM |
| 14 |  |
2.4 ± 1.0 nM |
| 15 |  |
16 ± 1 nM |
| RQ-00203078 | 3± 1 nM | |
| icilin | EC50 | 74 ± 3 nM |
| (−)-menthol | EC50 | 5.7 ± 0.72 μM |
a
IC50 is defined by concentration of the compounds that inhibit 50% of icilin-evoked Ca2+ entry.