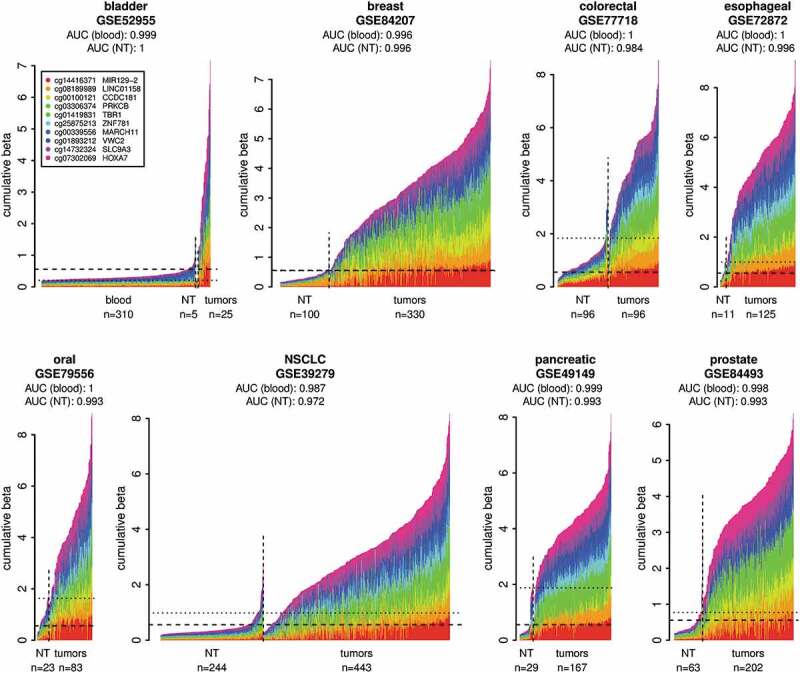
Figure 2.

Validation of the DNA methylation biomarker set on independent cancer sample cohorts from the GEO. Normal whole blood cohort (GSE72773) and respective normal tissues (NT) were used as controls. The plots show DNA methylation of the marker set in individual tumour samples in comparison to normal blood samples and respective NT samples. The samples were classified as tumours or normal based on the metadata from GEO. The x-axis indicates individual samples. The y-axis shows cumulative beta values for the entire marker set and the individual markers in the set are distinguished by colours. The DNA methylation data from the normal blood cohort are shown only in the first panel and are represented in the additional panels by the horizontal dashed lines showing the 95th percentile of the cumulative DNA methylation of the normal blood cohort. The horizontal dotted lines indicate the 95th percentiles of the cumulative DNA methylation of the respective NT cohorts. The AUCs were calculated using the cumulative beta values for the entire marker set for each sample from the respective tumour cohort and the normal blood cohort or respective NT as a normal reference for each cancer type.
