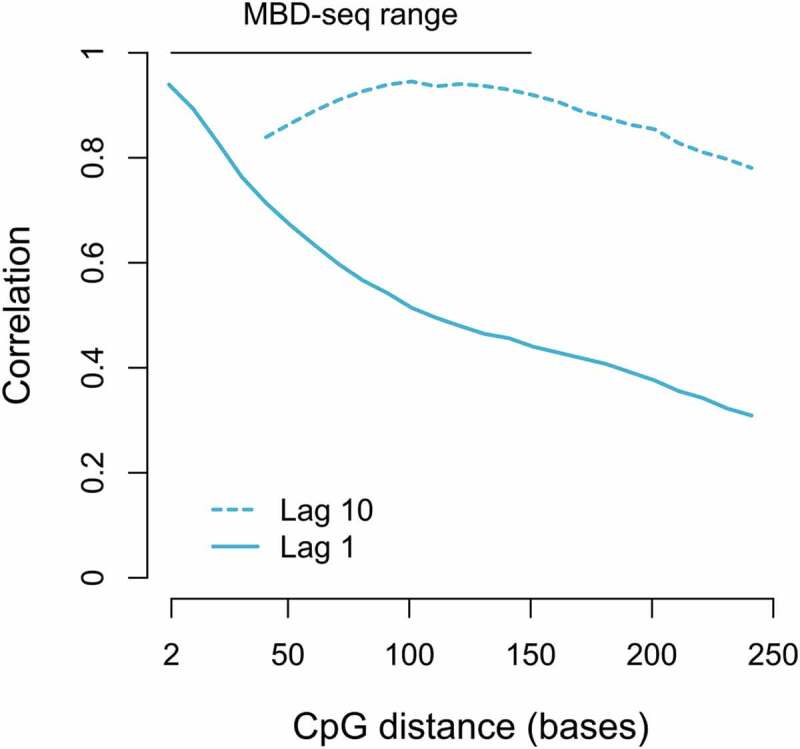
Figure 2.

Correlation between nearby located CpGs.
Using WGB-seq data [2] the estimated correlation (y-axis) is plotted against the distance (bp) between CpGs. The typical resolution range (150 bp) of MBD-seq is indicated by the horizontal bar at the top of the graph. The pairwise correlation between neighbouring CpG with lag 10 (the correlation between CpG 1 and CpG 11; CpG 2 and CpG 12 etc.) and lag 1 (the correlation between CpG 1 and CpG 2; CpG 2 and CpG 3 etc.) is represented by a dashed and a solid line, respectively.
