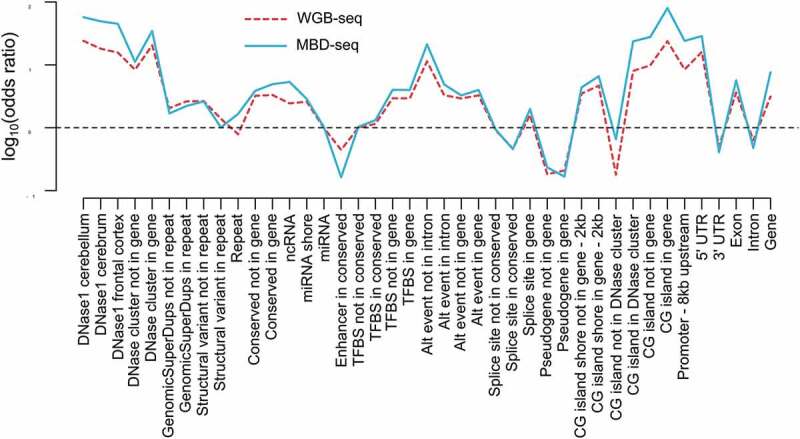
Figure 4.

Genomic enrichment profiles across biological features are comparable for MBD-seq and WGB-seq.
Methylation profiles across genomic features. The red line represents WGB-seq and the blue line MBD-seq enrichment profiles. The x-axis show the genomic feature tested and the y-axis the log10 of the odds ratio calculated from the 2 by 2 tables where loci were classified as methylated versus non-methylated and genomic features as present versus absent.
