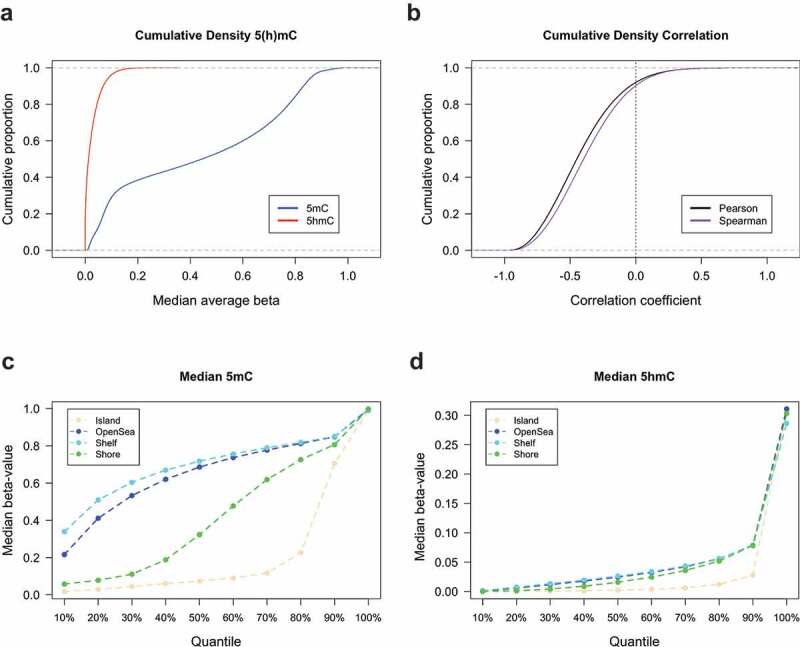
Figure 1.

Abundance and genomic distribution of 5hmC in breast tissue. (a) Cumulative density distributions of median 5hmC and 5mC methylation beta-values breast tissue (n= 18). (b) Cumulative density distributions of Pearson and Spearman correlation coefficients as calculated for the relationship between 5hmC and 5mC beta-values at each CpG loci across all breast tissues (n= 18). Percentiles of median 5mC (c) and 5hmC (d) beta-values as calculated across all breast tissues and stratified by CpG island context (islands, shores, shelves, and open sea regions).
