
Figure 3.
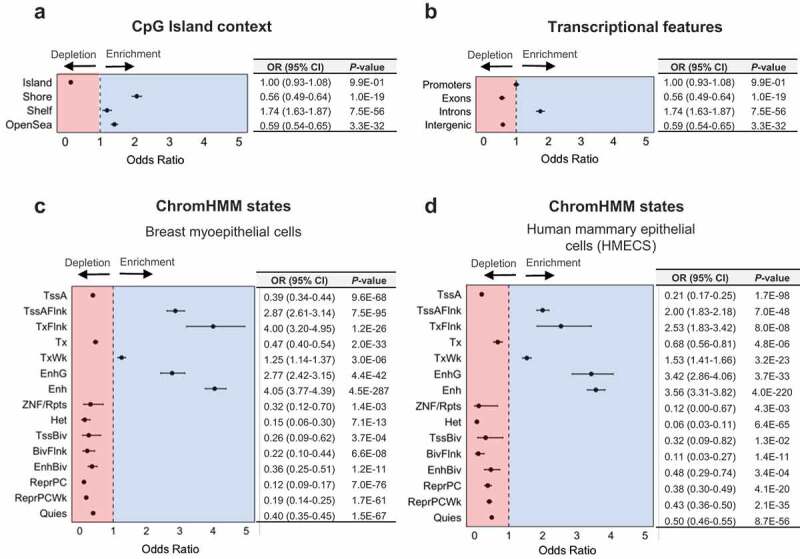
5hmC is enriched among genomic regions associated with transcriptional regulation. Forest plots show enrichment of high 5hmC CpGs, as determined across 18 normal breast tissue samples, among (a) CpG island regions (CpG islands, shores, shelves, and open sea regions), (b) transcriptional features (promoters, introns, exons, or intergenic regions), (c) ChromHMM states in breast myoepithelial cells (E027), and (d) ChromHMM states in human mammary epithelial cells (HMECs, E119). Enrichment was determined using Fisher’s exact tests (in a) or Cochran-Mantel-Haenszel tests (in b–d) to calculate odds ratios (ORs) and 95% confidence intervals (95% CIs), with the 450K background set of CpGs used as the background, while controlling for CpG island context (islands, shores, shelves, open seas). Numerical values for odds ratios and P-values are provided in tables adjacent to each forest plot.