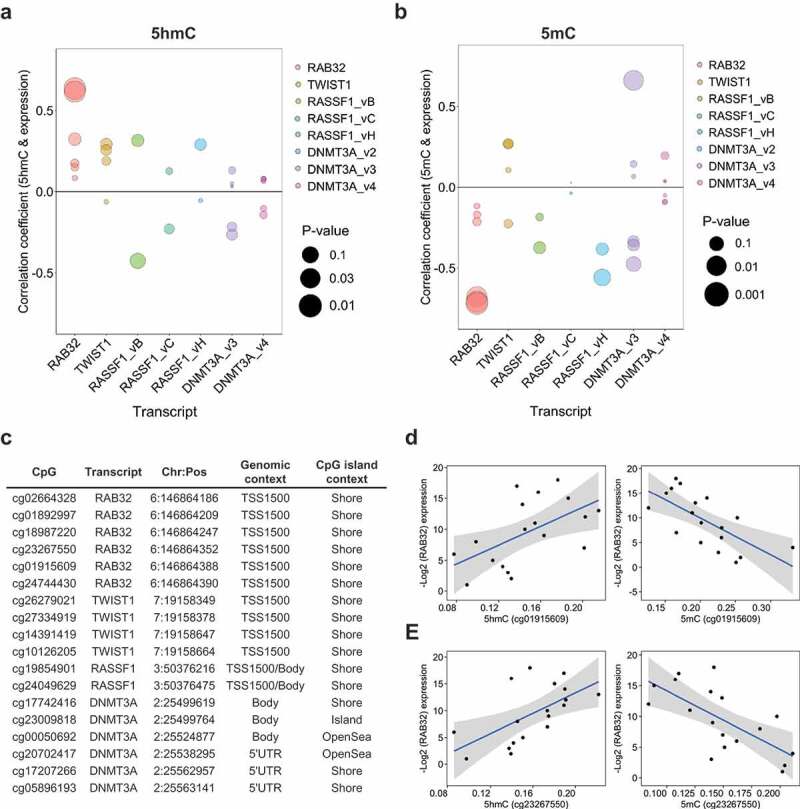
Figure 4.

5hmC is positively associated with gene expression. Spearman correlation coefficients of the relationship between 5hmC (a) and 5mC (b) abundance and gene expression at high 5hmC CpGs associated with candidate genes of interest. Colors denote the methylation-expression relationship of CpGs associated with the genes denoted on the x-axis. Bubble size corresponds to statistical significance (-Log10 P-value) associated with the correlation coefficient. (c) Genomic annotation for the 18 high 5hmC CpGs tested for correlations between methylation and gene expression. (d and e) Scatter plots of subject-specific 5hmC or 5mC beta-values for cg01915609 (d) and cg23267550 (e) against Log2 expression values for RAB32. Regression line indicated in blue with 95% confidence bands in gray.
