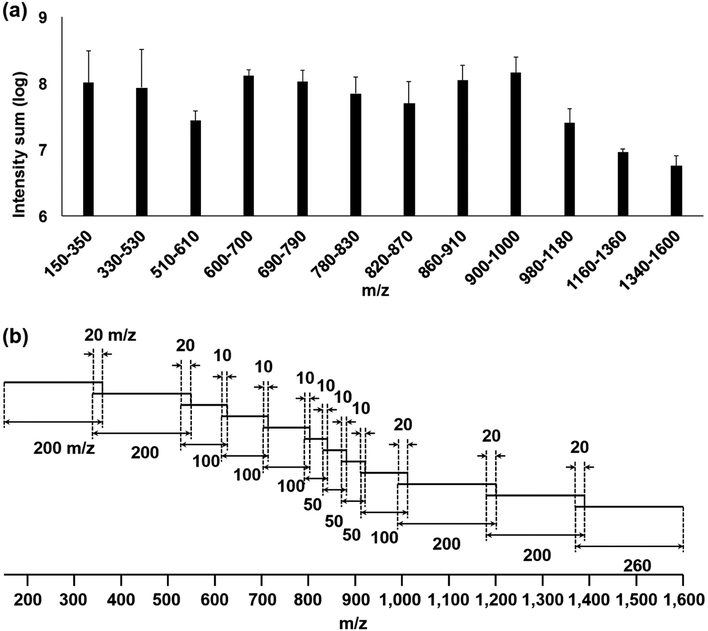
Figure 1. Schematic of S7 optimized for the ion density silhouette of mammalian lipids.
(a) Average log intensity sum of 12 m/z ranges from WFS (113 scans averaged) spectra of macrophage M0 subtype lipid extracts (triplicate). Error bar is RSD. (b) Distribution of 12 segments of a single S7 cycle with different m/z widths and different number of scans overlap by 10 or 20 m/z. The mass range is m/z 150–1,600 with an AGC target of 1 × 10⁵. A total of 18 S7 cycles comprised a single analytical run.

