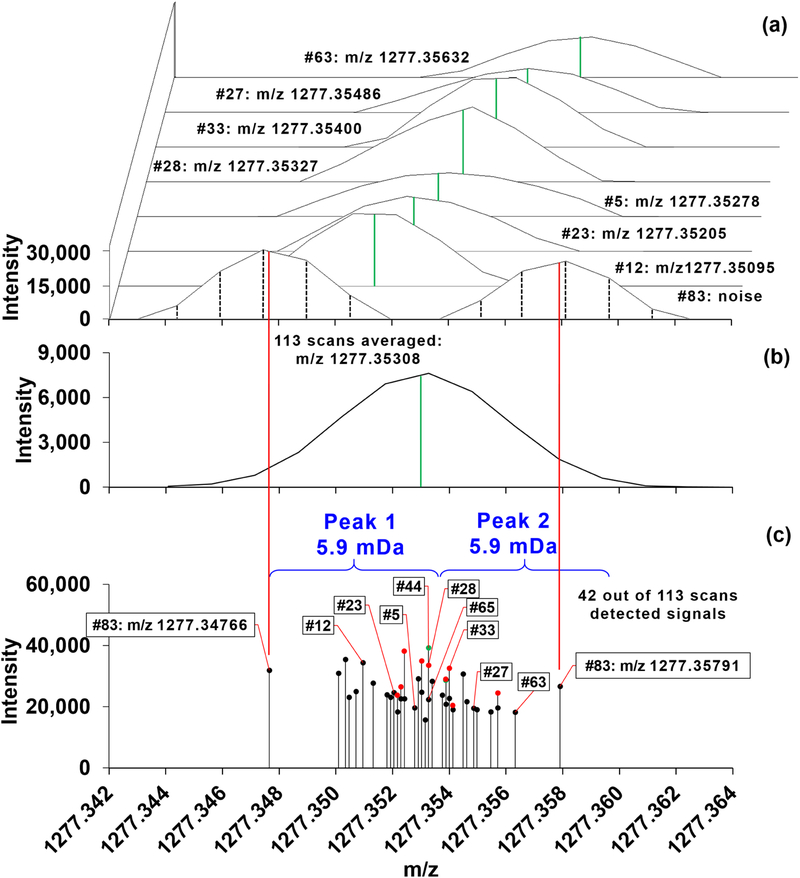
Figure 3. FWHM-based bin width threshold and averaging peaks under WFS acquisition.
Solvent mixture from 2.2.1 was injected and a single raw file was acquired via WFS with 5 microscans per scan spanning 10 minutes of acquisition time, up to 113 scans. (a) Skewed-overlay spectra from 8 selected scans out of the total 42 scans that detected signals in the m/z range of m+1 of PDMS [C34H102O17 Si17 + NH4]+ across 113 scans. The scan numbers are annotated as #63, #27, #33, #28, #5, #23, #12, and #83 from top to bottom. The acquired raw files could be presented by either stick plots of profile data (black vertical dashed lines of 83rd scan) or spectra that were generated by drawing the lines from point to point of the profile data. Centroided m/z values along with the profile data were available using the default centroiding algorithm (Thermo calls “label data”). These centroided m/z values were used in this study. The centroided m/z values are put next to the scan numbers and noted in the spectra as solid green lines. (b) The 113 scans were averaged via Xcalibur with the solid green line marking the centroided m/z value. Note that Xcalibur reports a single peak with the noise signals from the 83rd scan merged into its base. (c) Distribution of the 43 peaks as the centroided m/z values from the 42 scans. Several scans had the exact same m/z values, which are indicated with colored dots (green and red); for instance, scans 28, 44, and 65 have m/z 1,277.35327. When the m/z range was binned based on FWHM, a putative single peak evident in (b) was separated into two (peaks 1 and 2) in (c) while merging the noise peaks into the analyte signals. The ~6 mDa bin width was calculated from the equation of a trend line of FWHM across m/z range of 150–1,600. The solid red lines from (a) to (c) show where the centroided m/z values of the noise peaks from the 83rd scan are located in relation to the other peaks in the region.

