FIGURE 2.

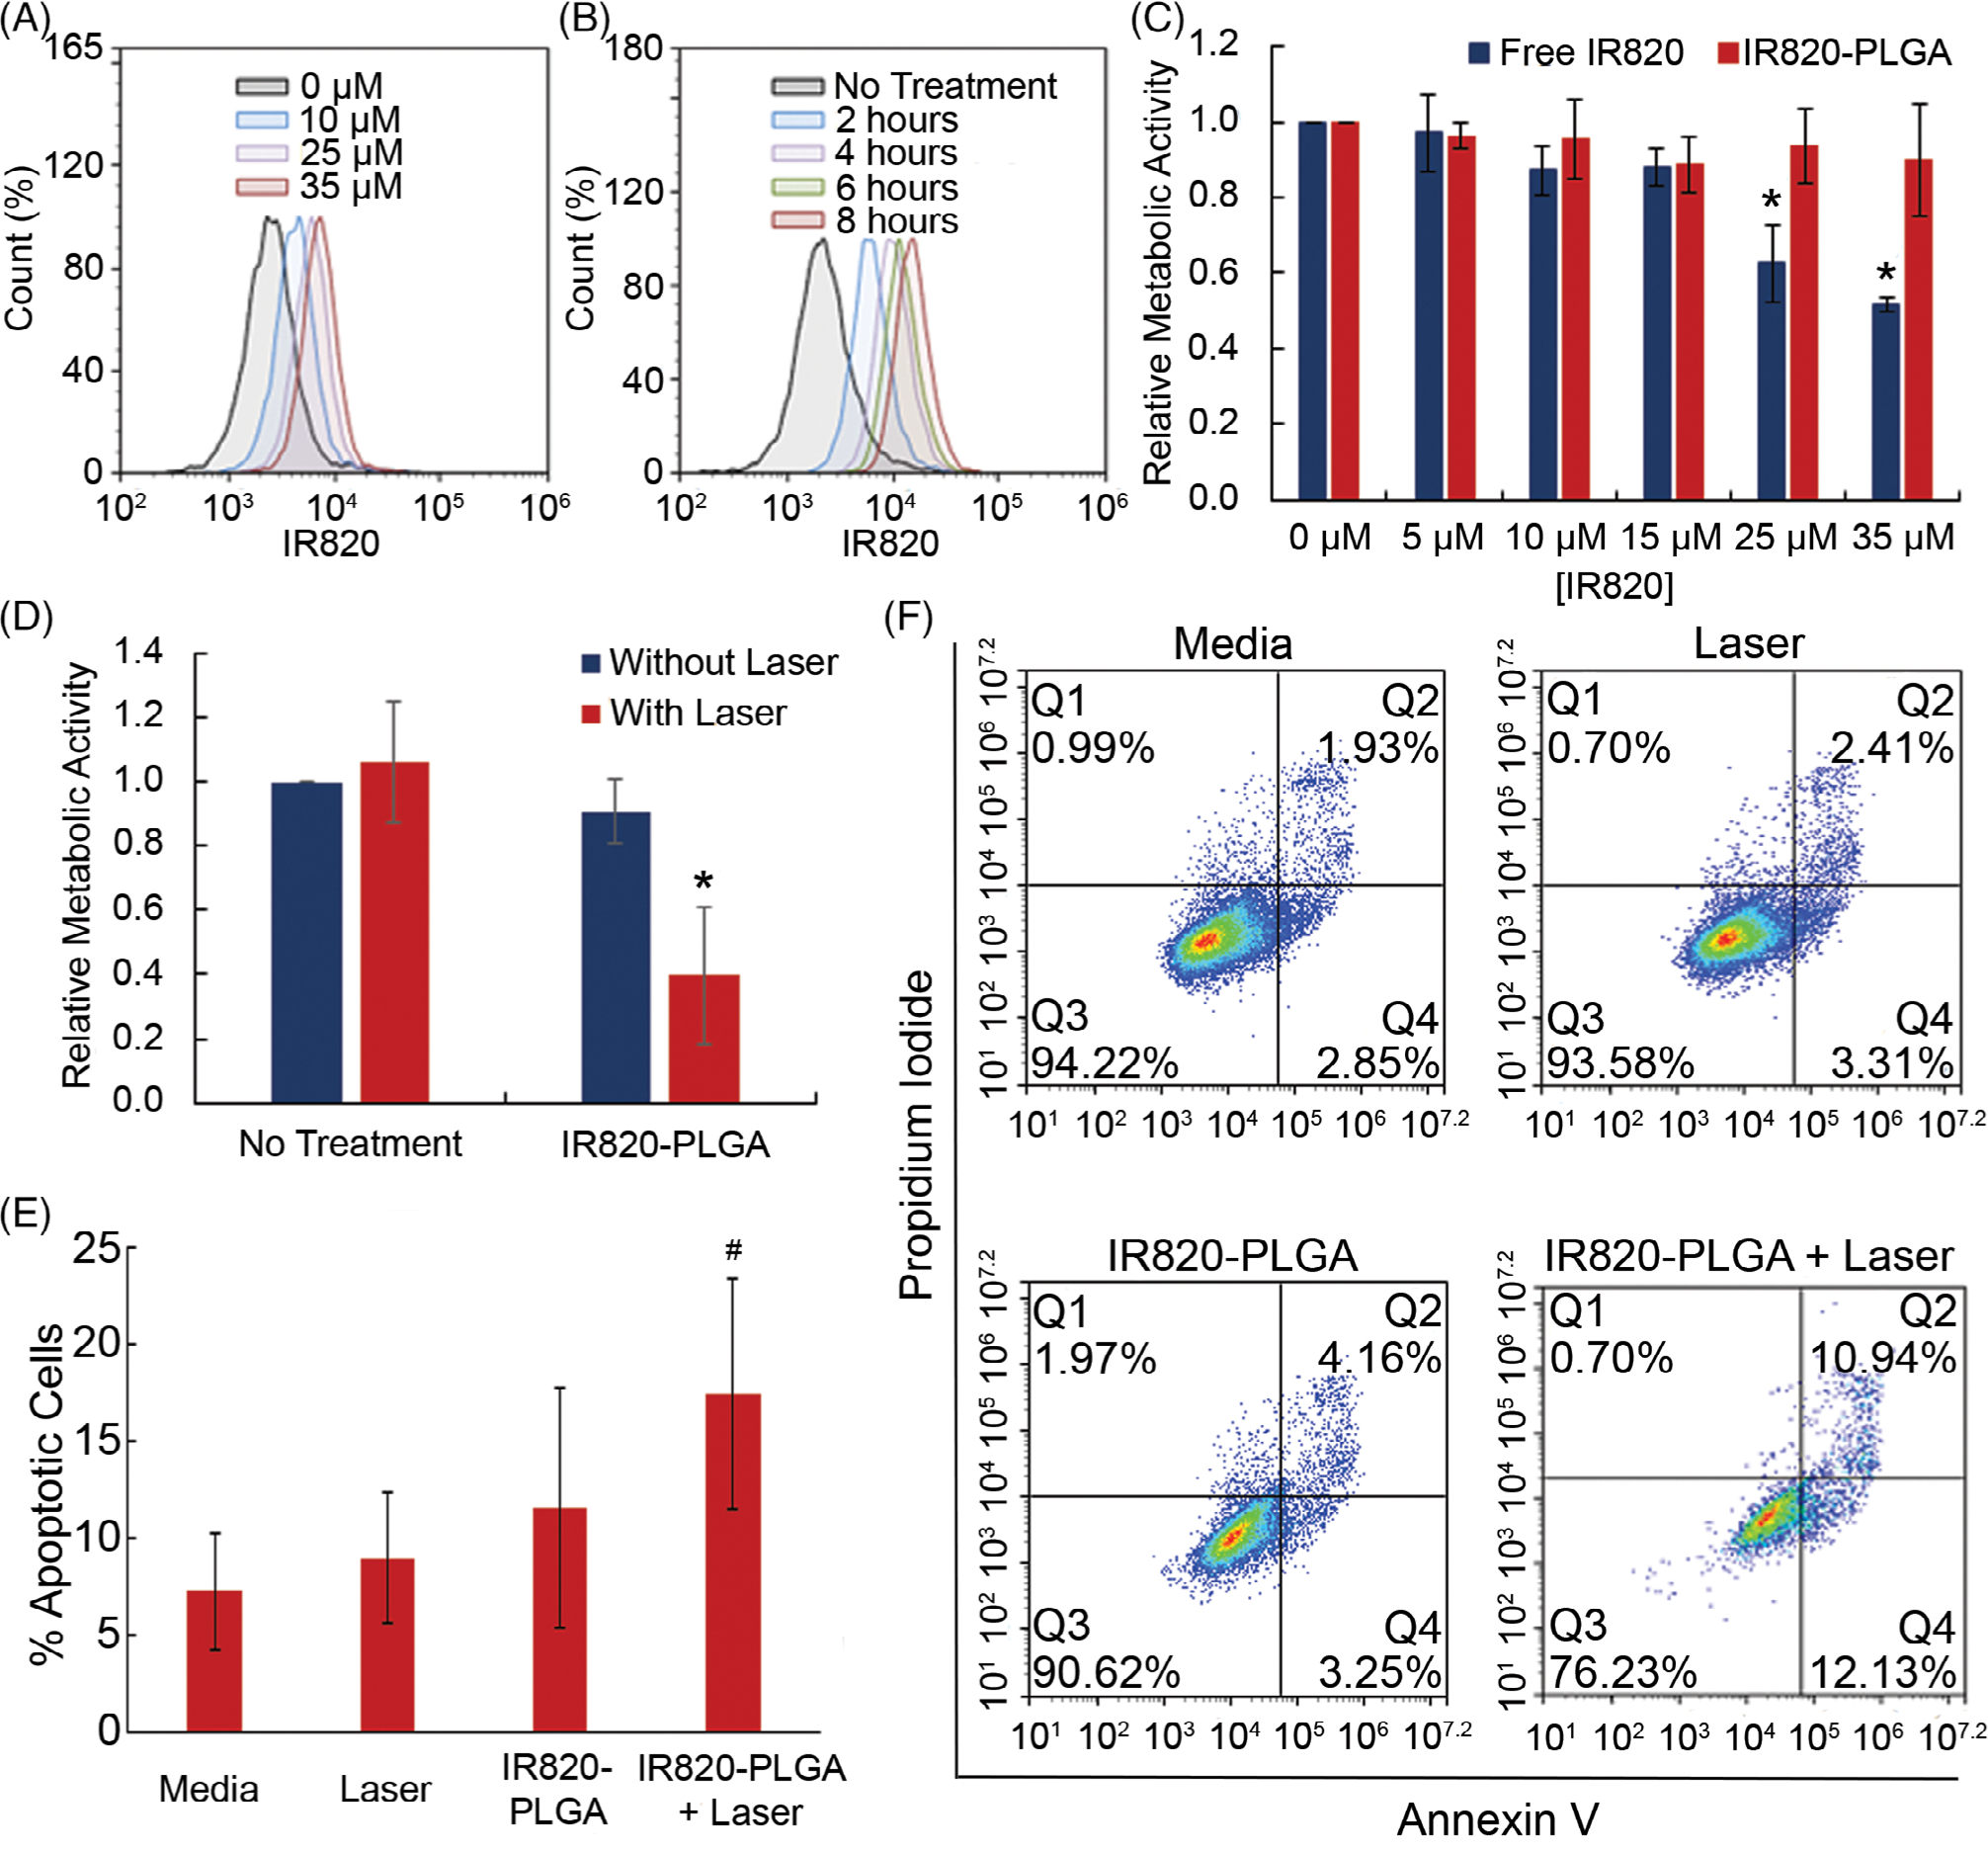
Flow cytometric analysis of the cellular binding and uptake of IR820-PLGA NPs based on (A) dose and (B) time of incubation. (C) Relative metabolic activity of MDA-MB-231 TNBC cells exposed to free IR820 dye or IR820-PLGA NPs without light exposure. *p < 0.05 (D) Relative metabolic activity of MDA-MB-231 cells that received PTT mediated by IR820-PLGA NPs (35 μM) and laser irradiation versus control cells that were exposed to only saline, only IR820-PLGA NPs (35 μM), or saline and laser irradiation. *p < 0.05 versus untreated control by ANOVA with post hoc Tukey. (E) The percentage of apoptotic cells in MDA-MB-231 samples that were exposed to no treatment, laser only, IR820-PLGA NPs only (10 μM), or PTT (IR820-PLGA NPs + laser; 10 μM). #p = 0.1 versus untreated control by ANOVA with post hoc Tukey. (F) Representative scatterplots demonstrating the fraction of MDA-MB-231 cells in early apoptosis (bottom right quadrant), late apoptosis (top right quadrant), or necrosis (top left quadrant) following treatment with media only, laser only, IR820-PLGA NPs only, or PTT (IR820-PLGA NPs + laser). Red color indicates a high density of cells and blue color indicates a low density of cells.
