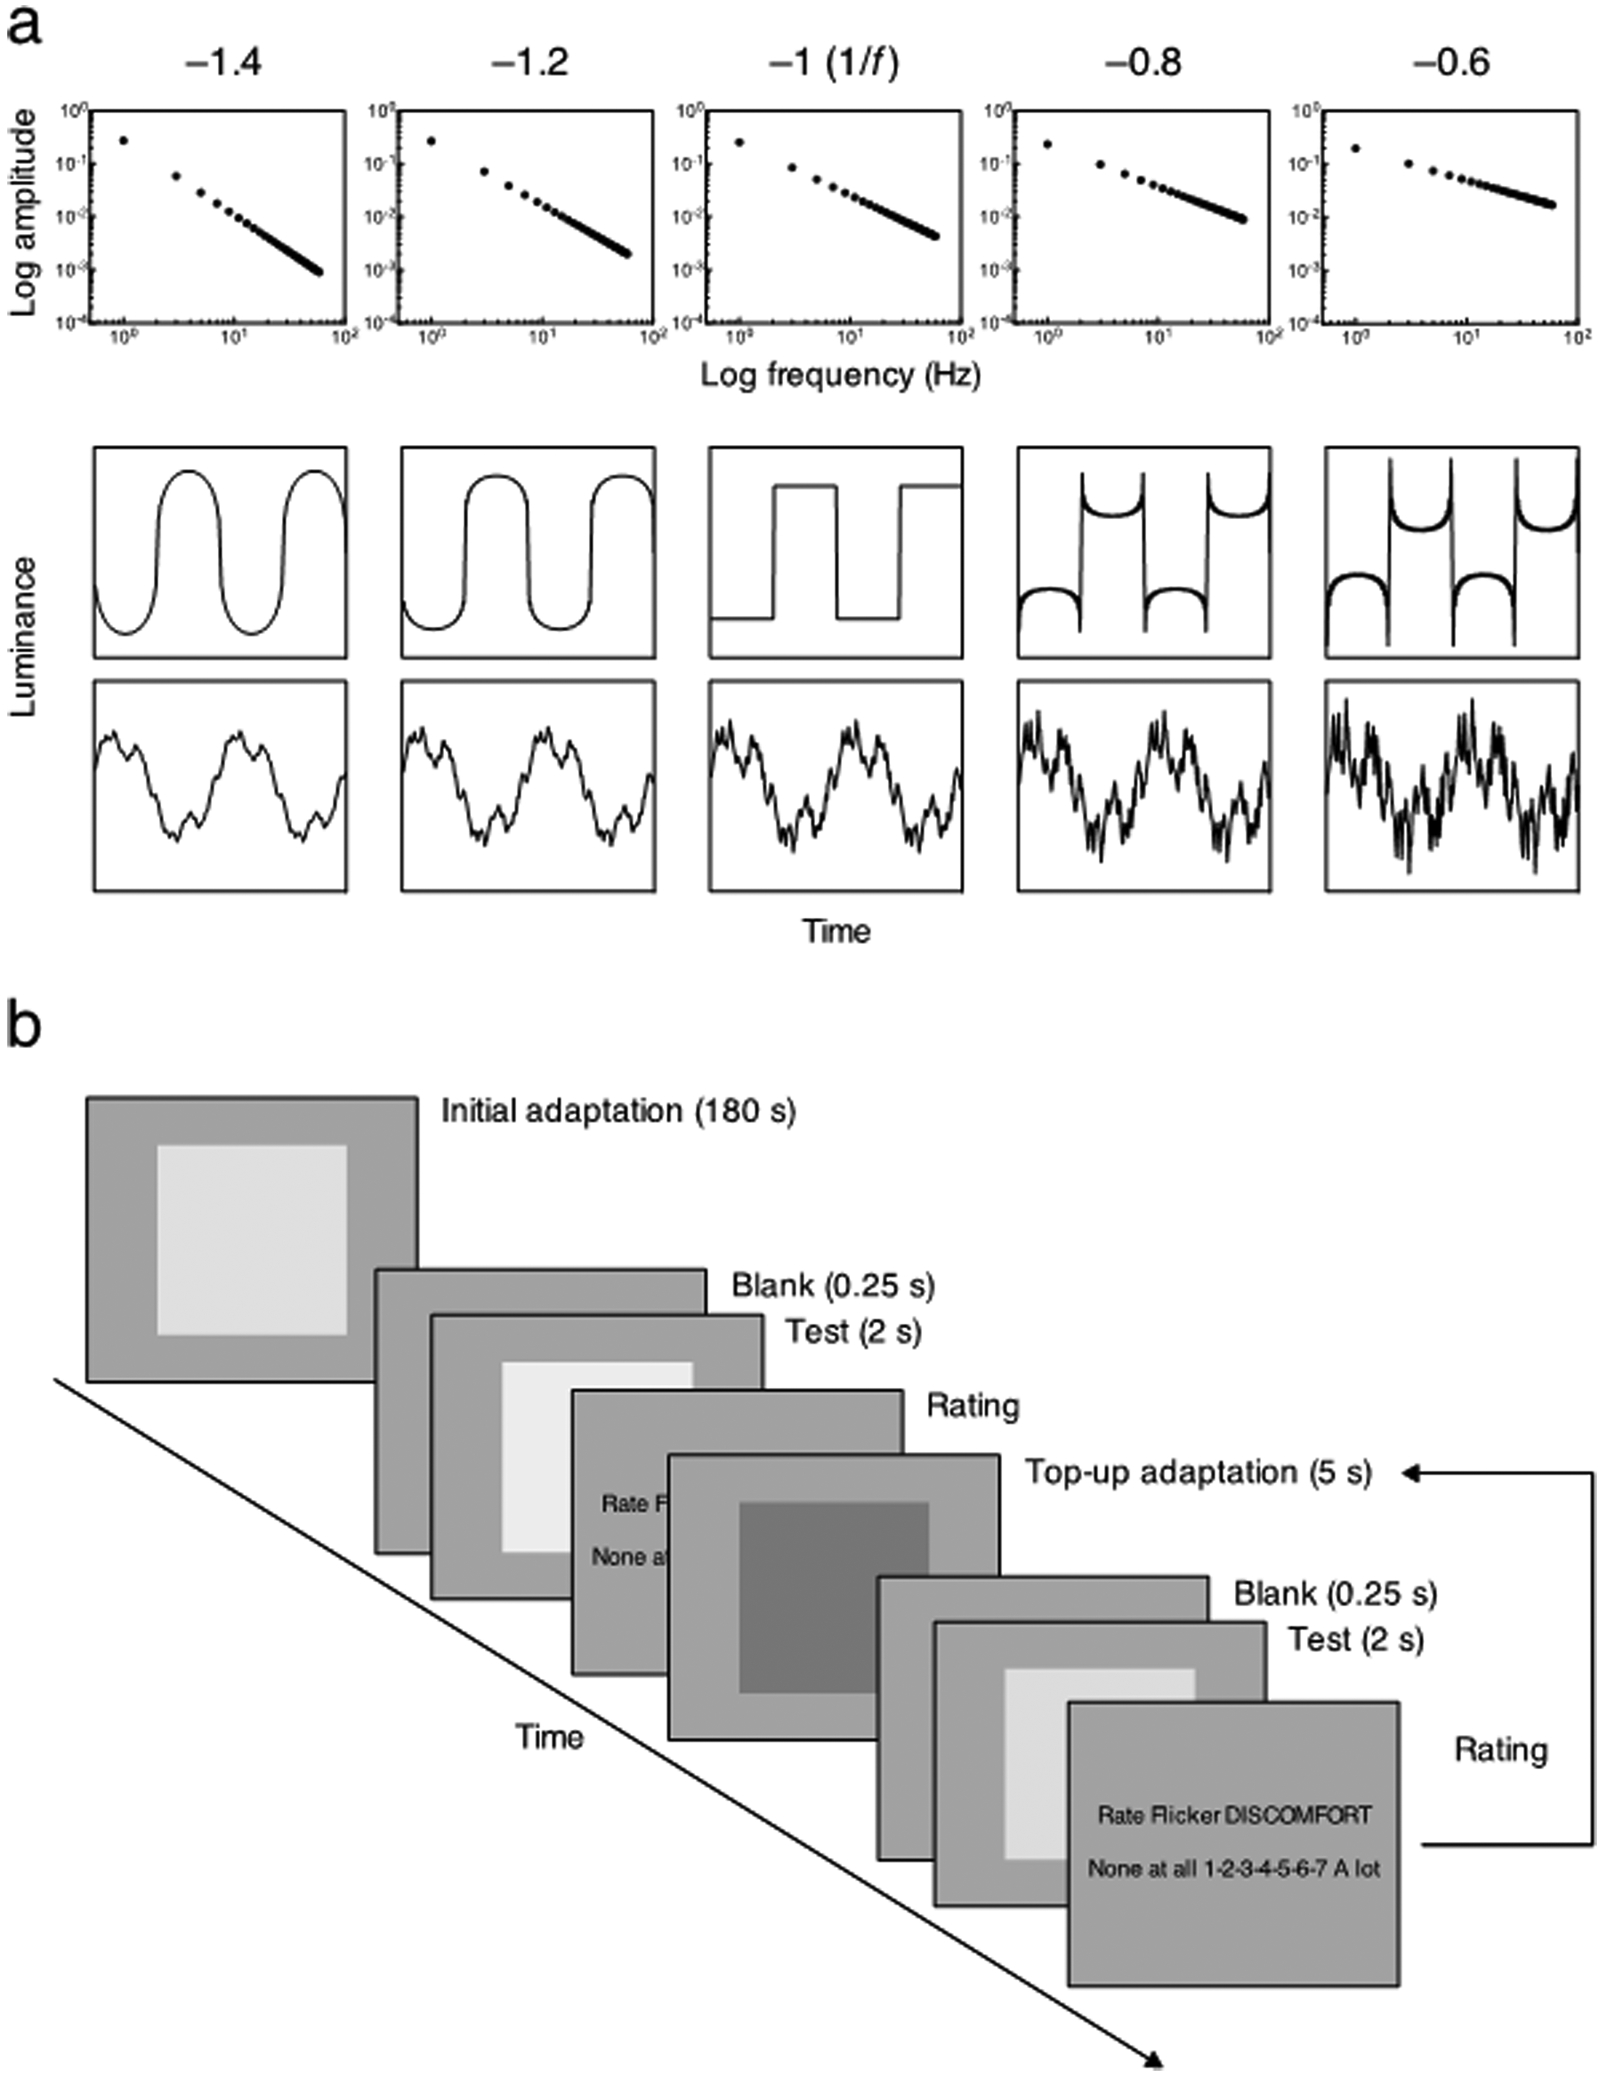
Fig. 1.

(a) Schematic example of the amplitude spectra (top) and the filtered waveforms with square wave (middle) or randomized phase spectra (bottom). The slope of the amplitude spectrum was –1.4, –1.2, –1, –0.8, or –0.6, from left to right. The amplitude spectrum is plotted as a function of temporal frequency on log-log axes (top). The luminance of the waveform is plotted as a function of time (middle and bottom). (b) Schematic description of the trial sequence with adaptation for the discomfort rating. Participants initially adapted for 180 s and then rated the discomfort from the 2-s test stimulus, as quickly as possible. A top-up adaptation stimulus was displayed for 5 s between each of the tests after participants responded to the previous test stimulus. The adaptation and test stimuli were separated by 0.25-s gaps with a blank screen. The same procedure was applied for the sharpness/blur rating.
