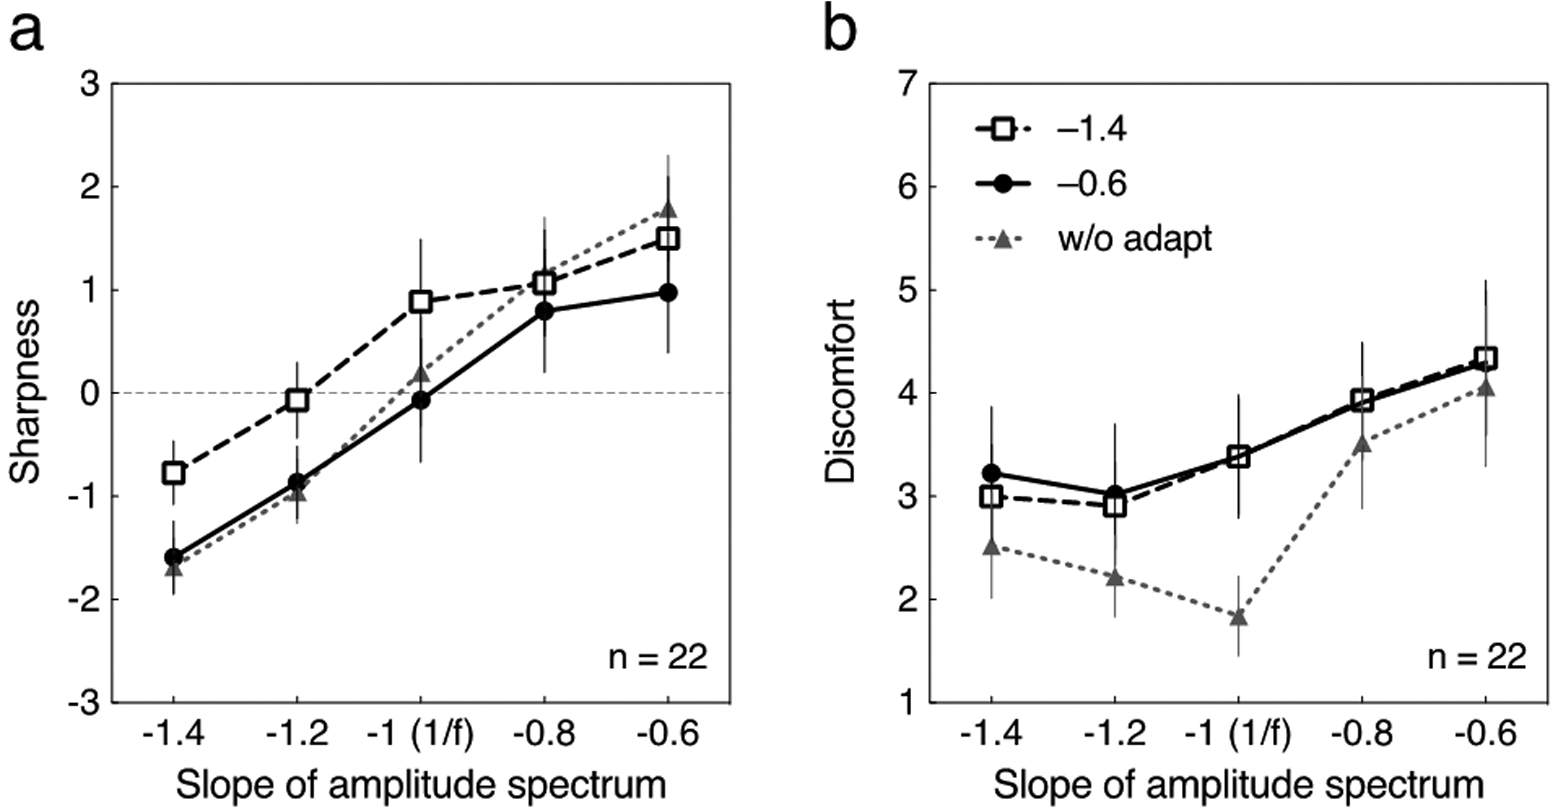
Fig. 4.

Averaged sharpness and discomfort ratings for the tests with a square wave phase spectrum for the 22 participants in the cross adaptation condition. The adapting stimuli had a random phase spectrum. Each curve represents data without adaptation (“w/o adapt”) or after adapting to blurred (–1.4) or sharpened (–0.6) transitions. Error bars represent 95% CI. Gray dotted line with triangle symbols are re-plots of the data at “w/o adapt” in Fig. 2. (a) The sharpness rating is plotted as a function of the slope of amplitude spectrum of the test stimulus. (b) The discomfort rating is plotted as a function of the slope of amplitude spectrum of the test stimulus.
