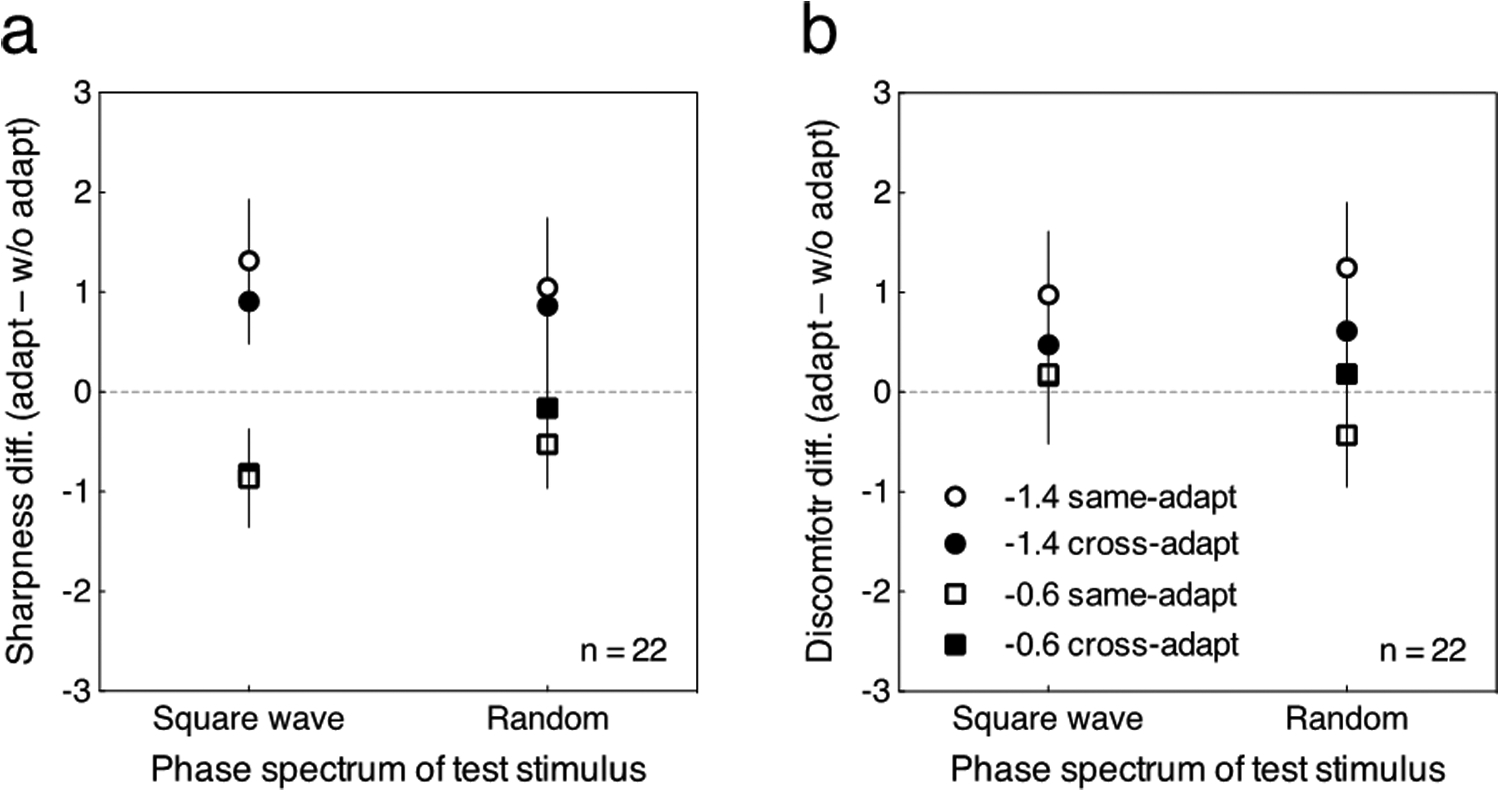
Fig. 6.

Re-plot of the data in Figs. 2, 3, 4, and 5. Each point represents the change in the rating for the amplitude spectrum that observers adapted to, after adaptation to the same or different phase spectrum. Error bars represent 95% CI. (a) The difference in sharpness ratings (adaptation condition minus pre-adaptation condition) plotted as a function of the phase spectrum of the test stimulus. (b) The difference in discomfort ratings (adaptation condition minus pre-adaptation condition) plotted as a function of the phase spectrum of the test stimulus.
