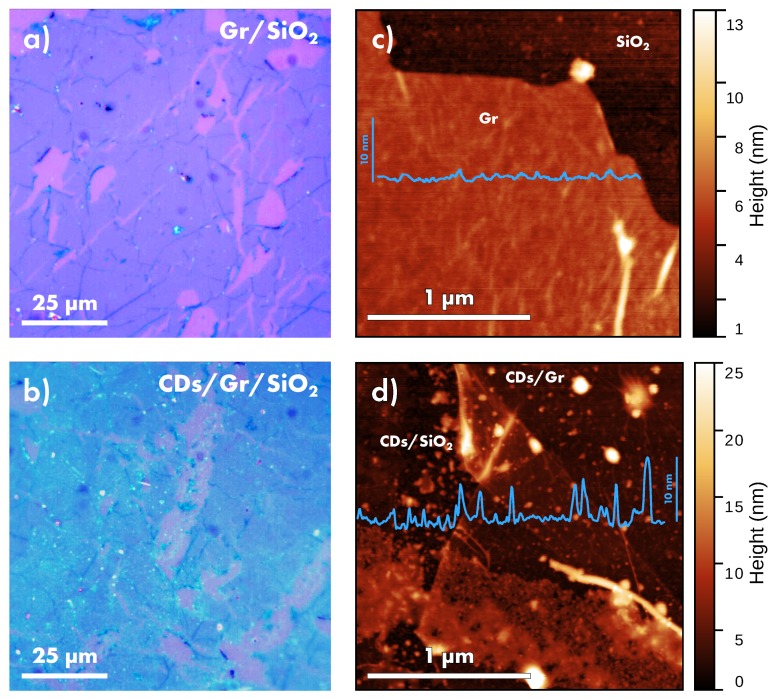
Figure 3.
Surface morphology evaluated by (a,b) optical microscopy, and by (c,d) atomic force microscopy of Gr/ and CDs/Gr/, respectively. In panel (d), the CDs deposited on (CDs/) and CDs deposited on graphene (CDs/Gr) can be distinguished. In addition, in panels (c,d), representative profile is reported (blue line) on the corresponding section line.

