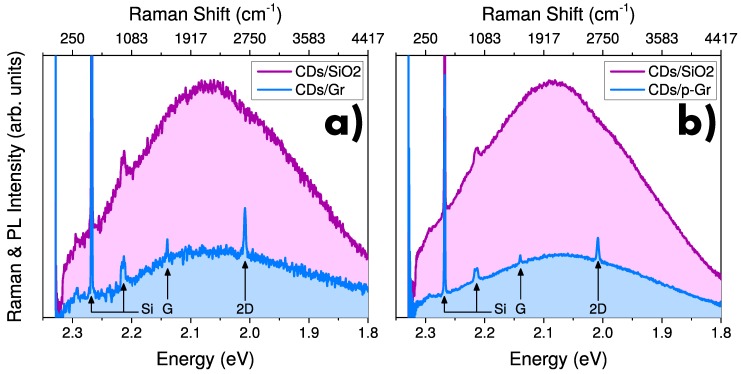
Figure 4.
-PL excited at 532 nm of CDs deposited on contiguous regions of graphene and for (a) CDs/Gr and (b) CDs/p-Gr. Raman bands of graphene and silicon are marked by arrows and labels. Energy axis is reported both in terms of absolute value (bottom), and in terms of the Raman shift, that is, the difference relative to the laser energy (top).

