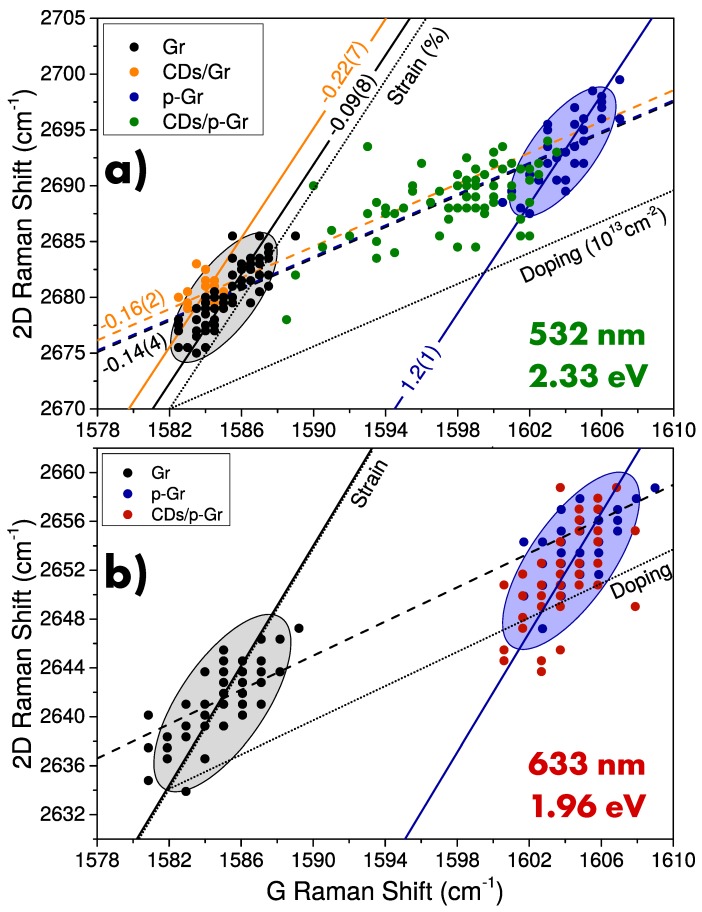
Figure 6.
G-2D correlation graph at (a) 532 nm and (b) 633 nm laser excitation of undoped (black dots) and p-doped Gr (blue dots) (reported from Reference [44] for 532 nm only), CDs/Gr (orange dots), and CDs/p-Gr(green/red dots). Doping and strain axes are marked by dotted lines and reference levels are pointed out by continuous and dashed lines, respectively.

