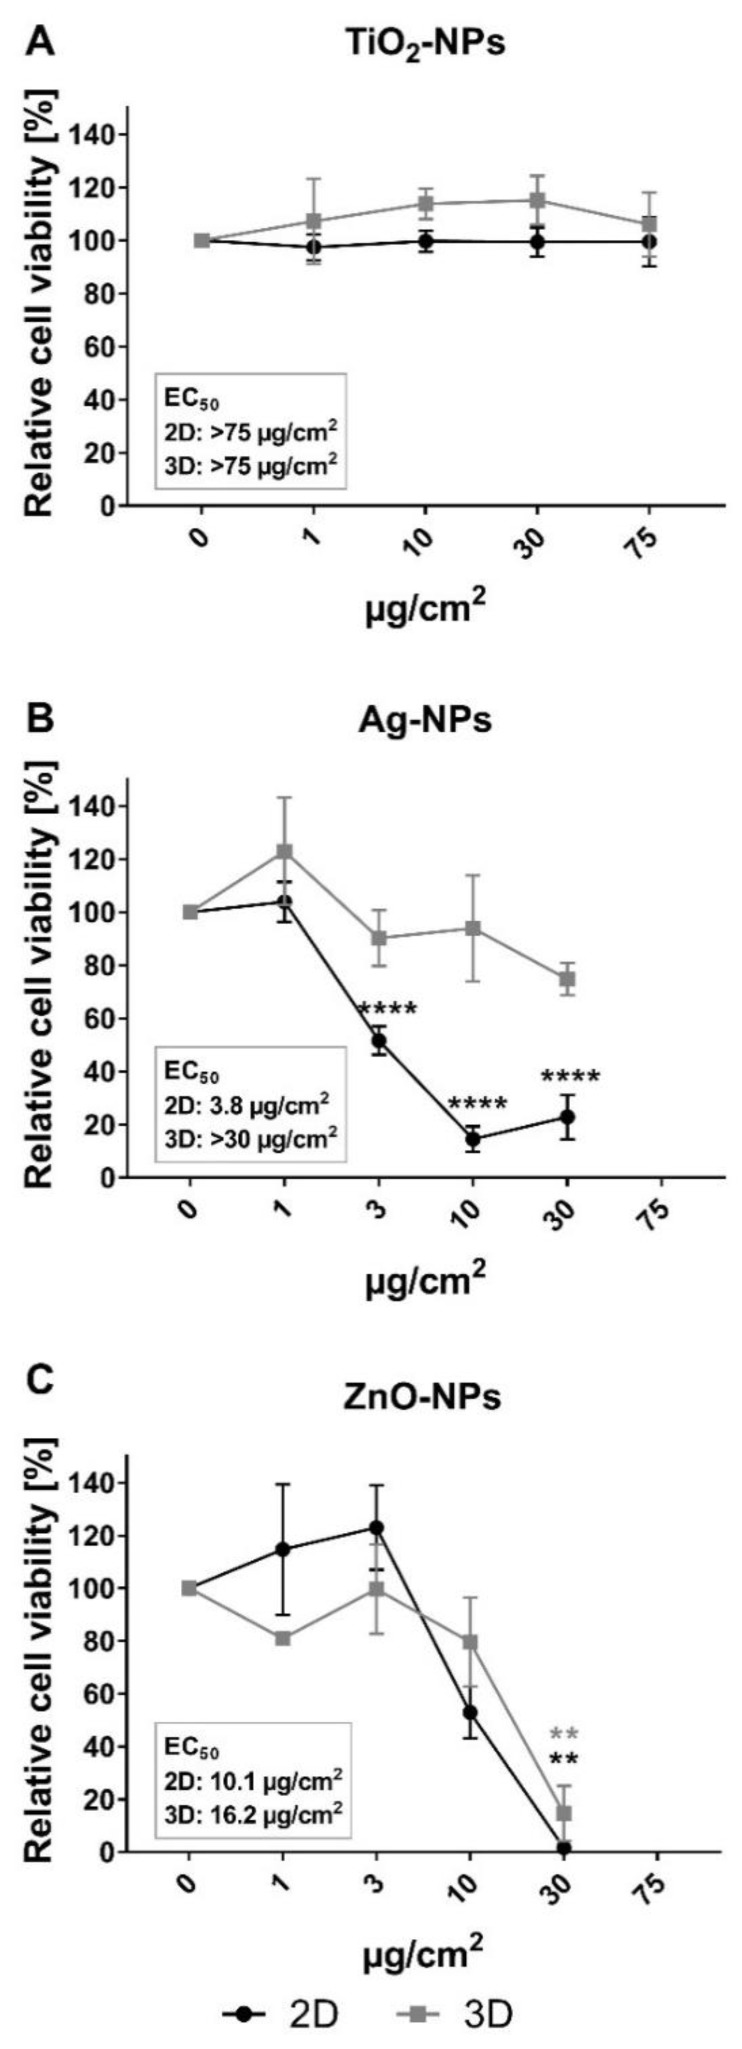
Figure 3.
Cytotoxicity of TiO2-, Ag- and ZnO-NPs measured by alamarBlue assay in 2D and 3D HepG2 cultures. Cell viability was measured as metabolic capacity and calculated relative to negative control cultures (set to 100%). (A) No significant effects were seen on the viability of 2D (black curve) and 3D (gray curve) cultures after 24 h exposure to TiO2-NPs. The cell viability was reduced after 24 h incubation with (B) Ag-NP and (C) ZnO-NP for both 2D and 3D cultures. The effect of the exposure was significantly different in 2D and 3D cultures after exposure to Ag-NP at concentrations 10 and 30 µg/cm2, evaluated by two-way ANOVA with post-test Sidak. Values are presented as mean ± SEM of 2–6 independent experiments: (A) n = 2, 3, (B) n = 4–6 and (C) n = 3. The concentration 75 µg/cm2 was excluded for testing of Ag-NP and ZnO-NP (b and c) because of high cytotoxicity in previously published experiments [36]. ** p < 0.01; **** p < 0.0001.

