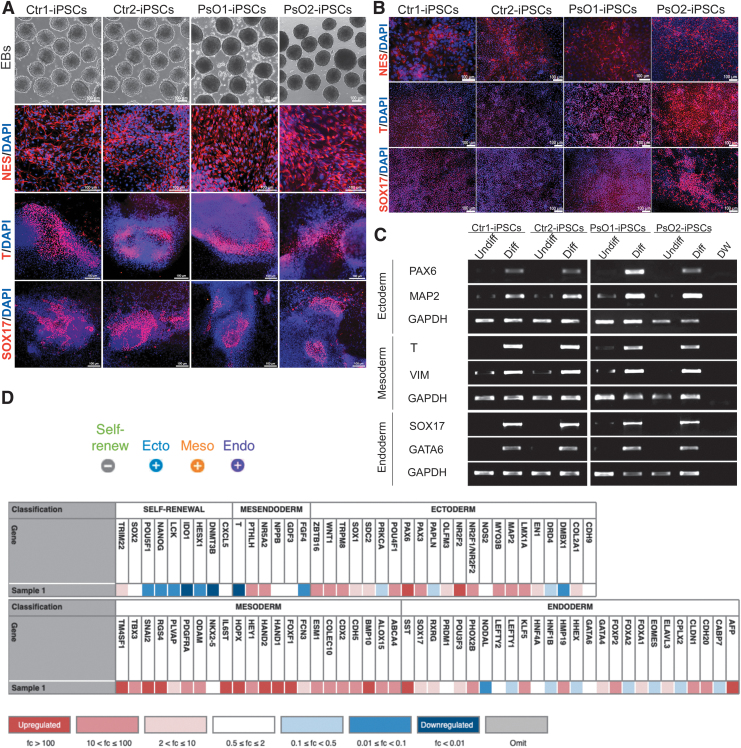
FIG. 2.
Characterization of the generated iPSC lines. Phase contrast of the spontaneously generated EBs from representative Ctr-iPSCs and PsO-iPSCs. Immunostaining showed the expression of the three germ layer markers, NESTIN, BRACHYURY (T), and SOX17 after spontaneous differentiation (A) and direct differentiaiton (B). (C) RT-PCR analysis of the three germ layer markers as indicated. The undifferentiated iPSCs of each sample used as a control. (D) Scorecard analysis of the EBs derived from iPSCs showing a represetnative heatmap of the indicated genes (self-renewal, ectodermal, mesodermal, and endodermal genes). Note that the expression of pluripotency markers were significantly downregulated and the trilineage markers were significantly upregulated in the representative images of Ctr1-iPSCs and PsO2-iPSCs. Scale bars = 100 μm. DW, distal water; EBs, embryoid bodies.

