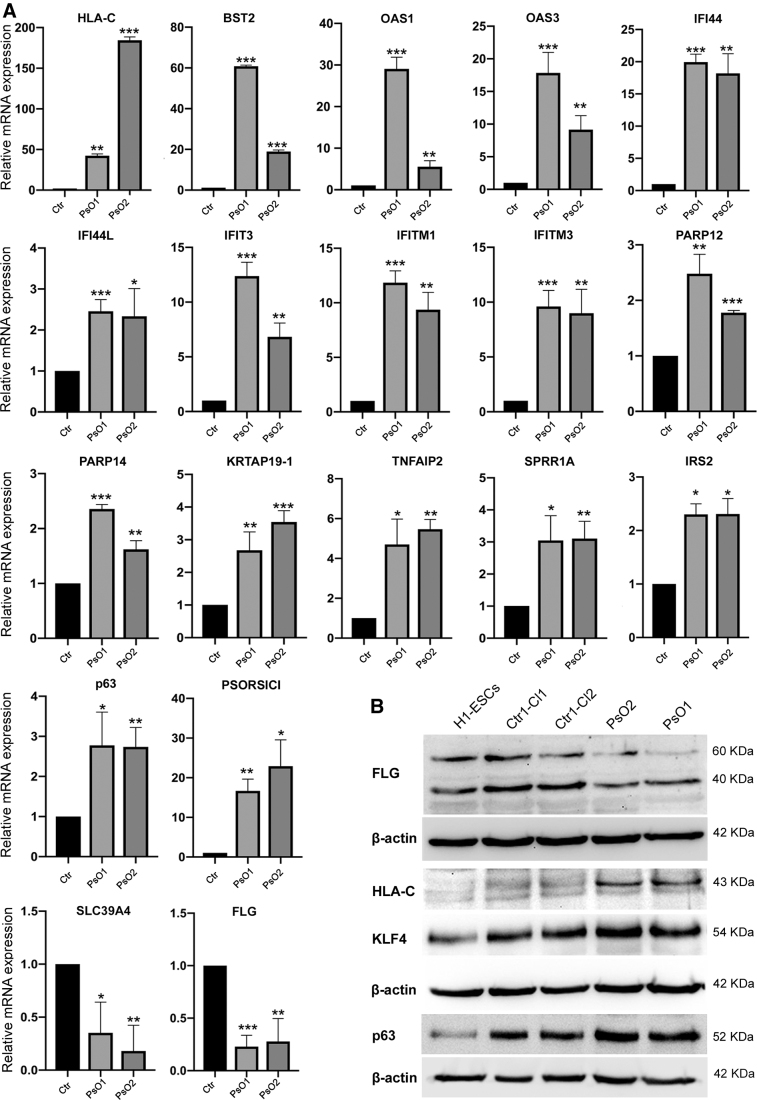
FIG. 5.
Validation of RNA-seq data using real-time PCR (qRT-PCR) and western blot. (A) qRT-PCR for the main genes deregulated in the RNA-seq results. Graphs show mean with SEM of three independent replicates and data were statistically analyzed using unpaired t-test. (B) Validation of gene expression using western blotting. *P < 0.05, **P < 0.01, ***P < 0.001. RNA-seq, RNA-sequencing.

