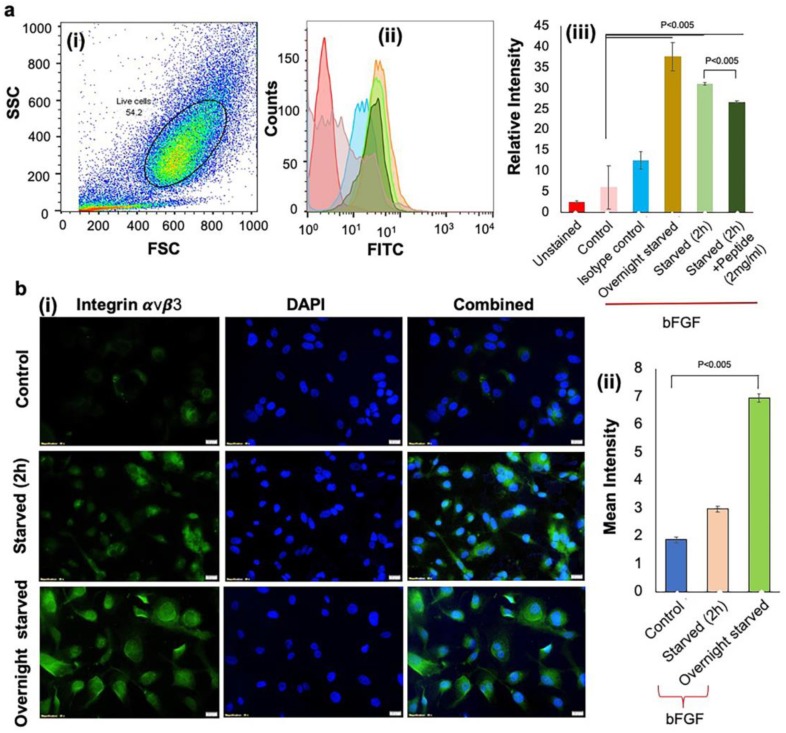
Figure 3.
Expression of αvβ3 by HUVECs under different conditions (a) Flow cytometry analysis demonstrated significant expression of integrin αvβ3 in overnight starved cells. (i) Side scatter (SSC) vs. forward scatter (FSC) plot used to gate live cells and resulting (ii) histograms from which αvβ3 expression was (iii) quantified for different culture conditions. Colors in (ii) match the conditions shown in the x-axis of (iii). Values were expressed as mean ± SD, n = 3. p < 0.005 was considered significant. (b) Immunostaining was performed by (i) staining HUVECs with anti-human CD51/CD61 antibody to detect integrin αvβ3 (green). Nuclei were stained by DAPI (blue). Integrin αvβ3 expression was highest under overnight starved conditions when compared to control and 2 h starvation. (ii) Quantification of the images in (i) obtained using Image J. Value was expressed as mean ± SD, n = 3. p < 0.05 was considered significant.

