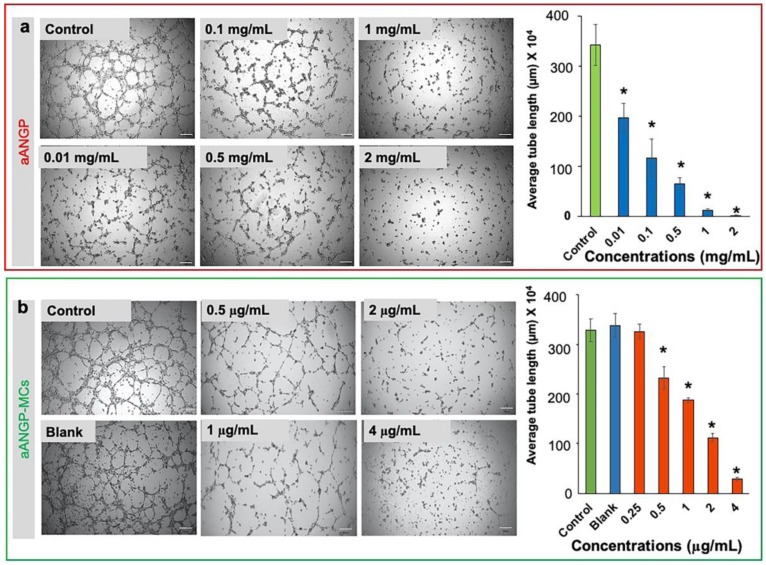
Figure 6.
Effect of aANGP and aANGP-MCs on HUVEC tube formation: HUVECs were seeded on.plates coated with ECM gel, incubated for 4 h with different concentrations of aANGP and aANGP-MCs and then imaged using an inverted microscope at 4× magnification. Images obtained for treatment with different concentrations of (a) free form aANGP and (b) aANGP-MCs. Bar graph represents the quantification of the tubes formed obtained using Image J. Values were expressed as mean ± SD, n = 3. * p < 0.0005.

