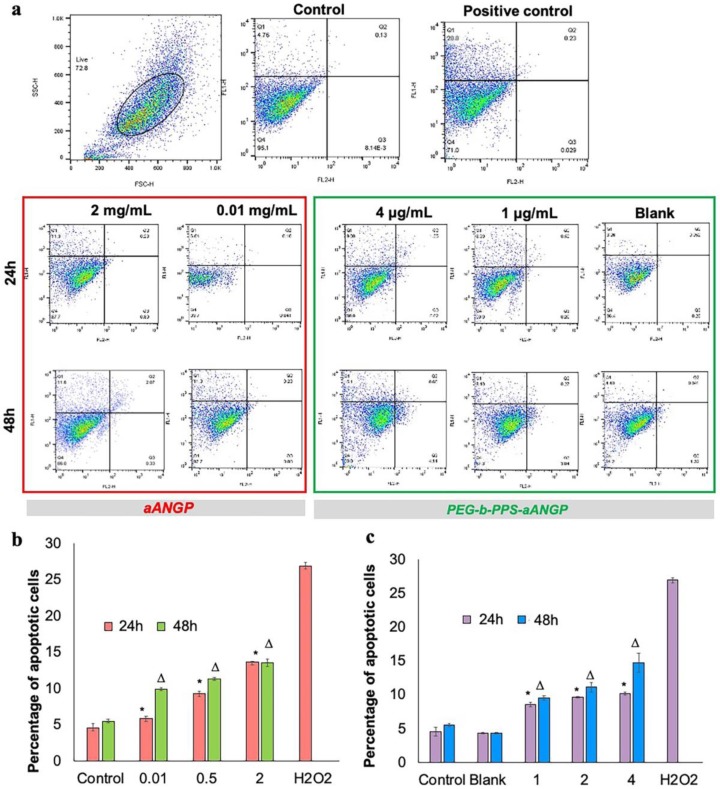
Figure 7.
Apoptosis induced by aANGP and aANGP-MCs: HUVECs were treated with different concentrations of aANGP and aANGP-MCs for 24 and 48 h followed by Annexin V-FITC and PI staining. (a) Dot plots obtained after analyzing aANGP treated HUVECs using Flow cytometry at 24 and 48 h. Bar graphs represent the quantification of the dot plots obtained for (b) aANGP and (c) aANGP-MCs treated HUVECs were stained with Annexin V-FITC and PI and imaged using a fluorescent microscope at 20× magnification. Values were expressed as mean ± SD, n = 3. * (24h) and Δ (48h) * p < 0.05.

