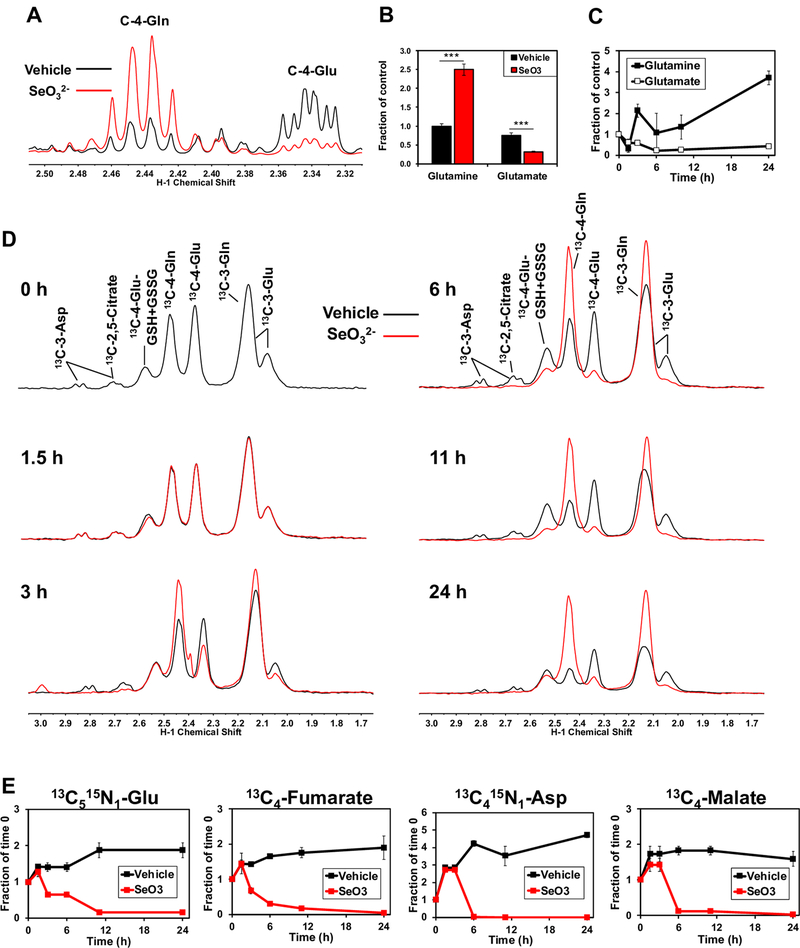
Figure 1. Selenite impairs glutaminolysis and blocks the synthesis of downstream metabolites in A549 cells.
A) 1D 1H NMR spectra were recorded from polar extracts of A549 cells treated for 24 h with 6.25 μM Na2SeO3. Spectra were superimposed and normalized to total protein to assess differences between treatments in the intensities of the C-4-Gln and C-4-Glu peaks at 2.44 and 2.34 ppm, respectively. B) The C4-Glu and Gln peaks were quantified and normalized to total protein. ***q<0.001, ** q<0.01. C) Total Gln and Glu normalized to total protein were obtained from GC-MS analysis of polar extracts recorded at 0, 1.5, 3, 6, and 24 h of selenite treatment. D) 1D 1H{13C} HSQC spectra were recorded from polar extracts of A549 cells pre-incubated for 2 hours with 13C5,15N2-Gln tracer and treated with or without 6.25 μM Na2SeO3 for 0, 1.5, 3, 6, 11, and 24 hours. Control and selenite spectra were superimposed and normalized to total protein to visualize differences between treatments in 13C-4-glutathione, 13C-4-Gln, and 13C-4-Glu at 2.54, 2.44, and 2.34 ppm, respectively. E) GC-MS data were acquired from these extracts and 13C5,15N1-Glu (m+6), 13C4-malate, 13C4-fumarate, and 13C4,15N1-Asp (m+5) were quantified and normalized to total protein.

