
Fig. 1. The LXR-Idol axis regulates LDLR abundance in the brain.
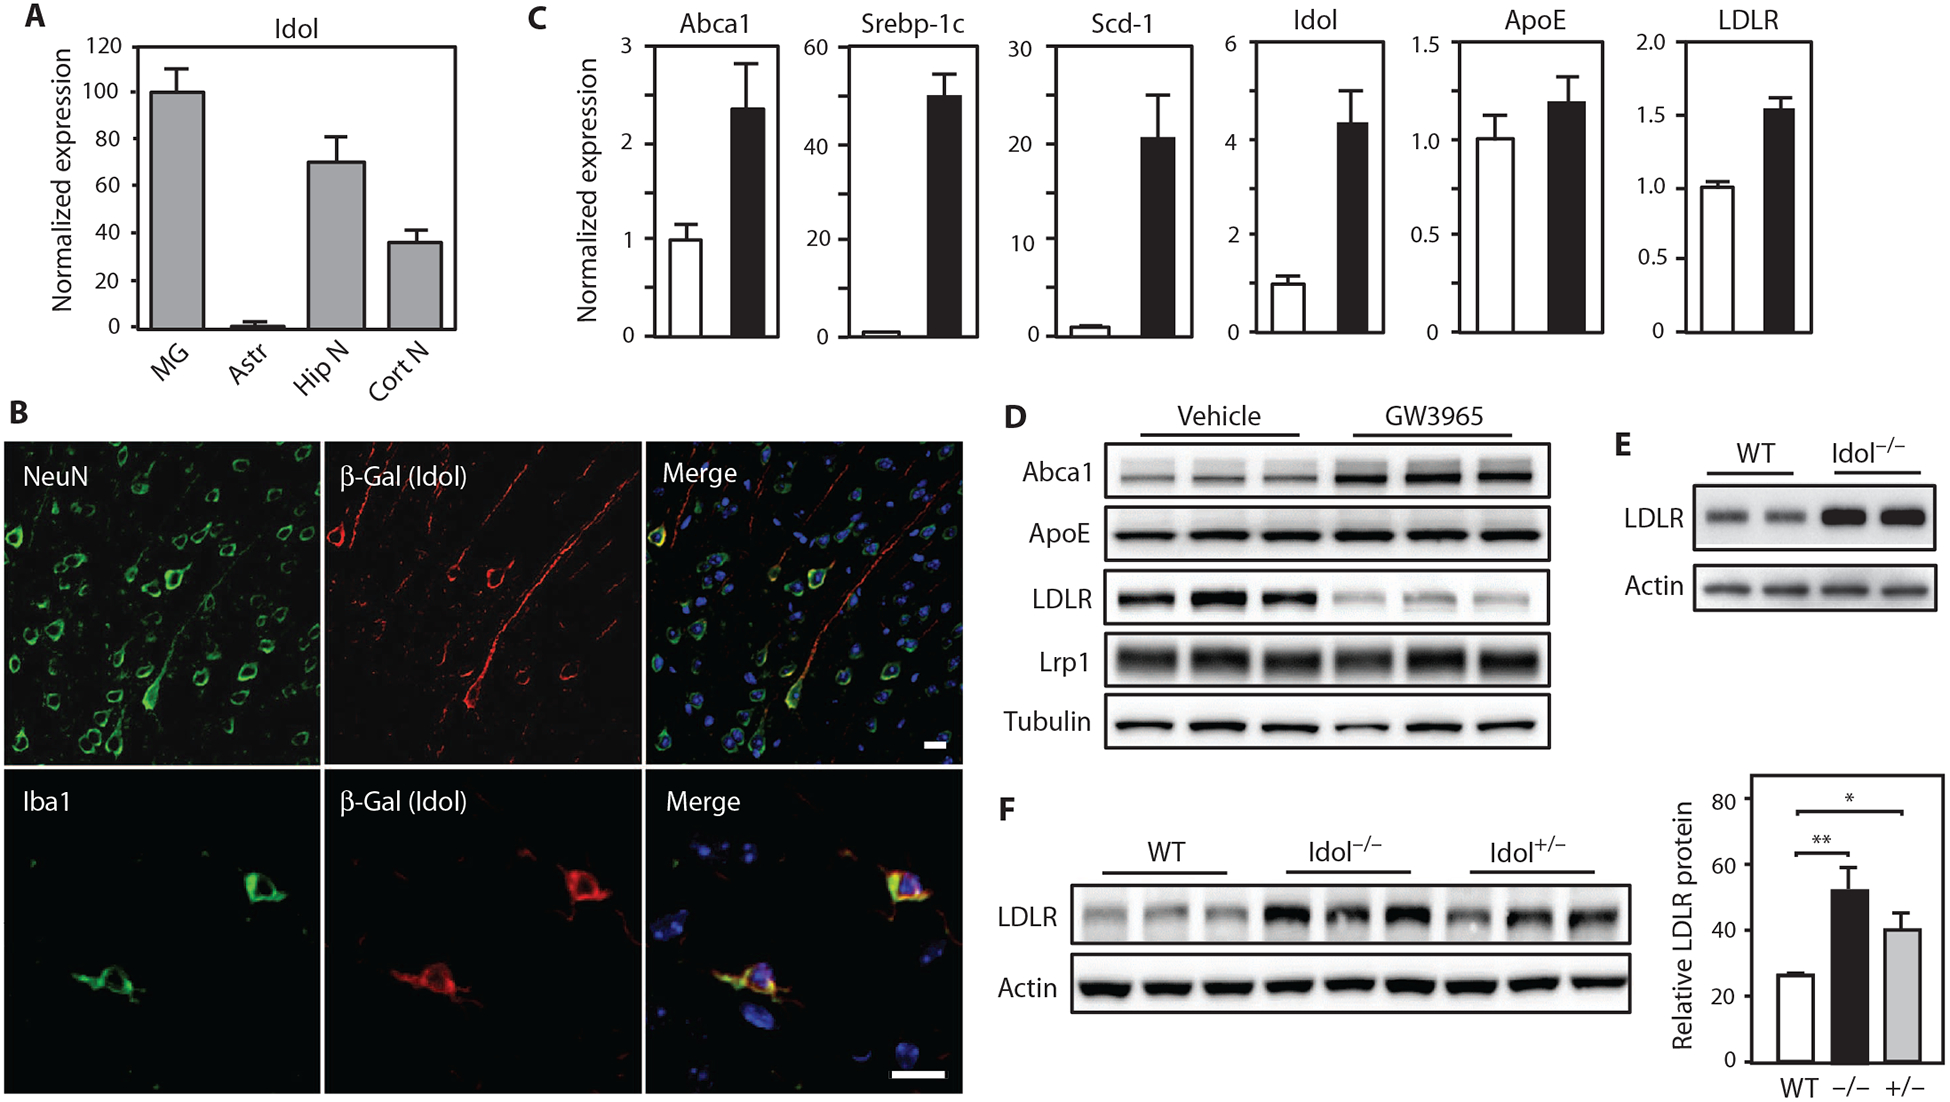
(A) Real-time polymerase chain reaction (PCR) analysis of Idol mRNA expression in different mouse brain cell types, normalized to microglial expression. MG, microglia; Astr, astrocytes; Hip N, hippocampal neurons; Cort N, cortical neurons. Error bars represent SEM. (B) Representative micrographs showing immunofluorescence staining of brain sections from the frontal cortex of Idol+/− mice. Images in top row show Idol expression in neurons. Images in bottom row show Idol expression in microglia. Green, NeuN (neuron) and Iba1 (microglia); red, Idol; blue, 4′,6-diamidino-2-pheny-lindole (DAPI; nucleus). Scale bars, 10 μm. (C) Real-time PCR analysis of LXR target gene expression in primary microglia treated with dimethyl sulfoxide (DMSO) or 1 μM GW3965 for 6 hours, normalized to vehicle (DMSO) control. Error bars represent SEM. (D) Immunoblot analysis of whole-cell lysates from primary microglia treated with DMSO or 1 μM GW3965 for 6 hours. Lanes represent samples from individual cultures. (E) Immunoblot analysis of whole-cell lysates from primary microglia isolated from Idol+/+ or Idol−/− mice. Lanes represent samples from individual animals. WT, wild type. (F) Immunoblot analysis of whole-cell lysates from the frontal cortex of Idol+/+, Idol+/−, or Idol−/− mice. Lanes represent samples from individual animals. Immunoblot signals are quantified on the right. Error bars represent SEM. *P < 0.05, **P < 0.01 by Student’s t test. Each experiment was performed at least twice.