
Fig. 3. Reducing Idol expression attenuates the deposition of fibrillar amyloid.
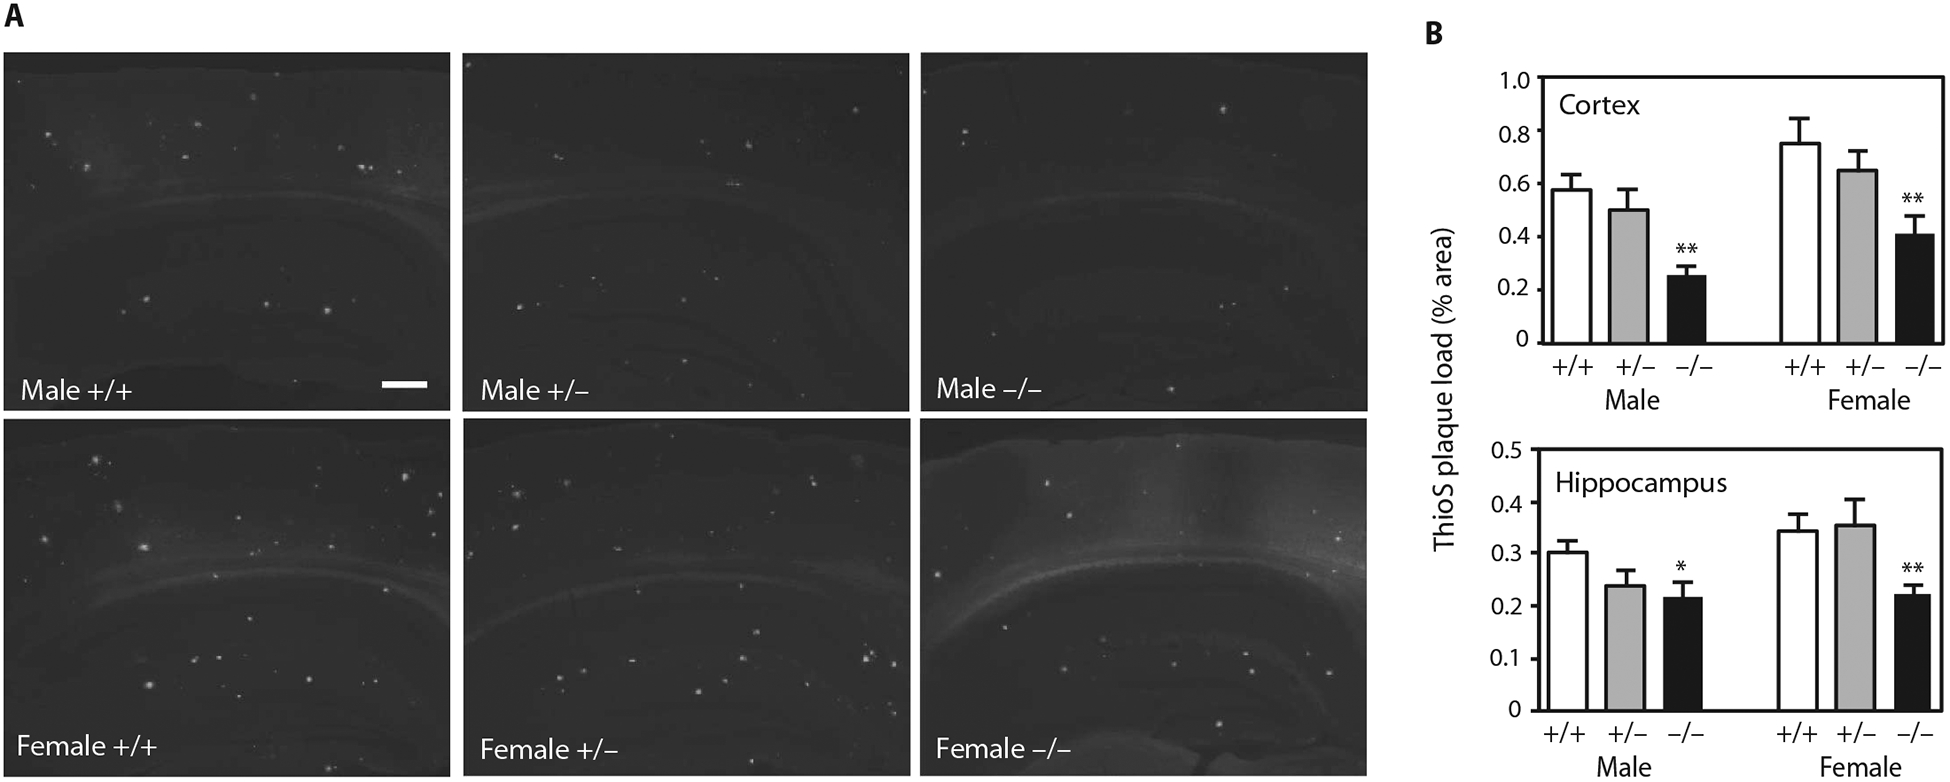
(A) Representative micrographs showing thioflavin S staining of brain sections from APP/PS1;Idol+/+, APP/PS1;Idol+/−, or APP/PS1;Idol−/− mice. White color indicates thioflavin S fluorescence. Scale bar, 250 μm. (B) Quantification of thioflavin S (ThioS)–stained Aβ plaque load in the frontal cortex and hippocampus of male or female APP/PS1;Idol+/+, APP/PS1;Idol+/−, or APP/PS1;Idol−/− mice. Error bars represent SEM. *P < 0.05, **P < 0.01 by Student’s t test. n = 6.