
Fig. 4. Reducing Idol expression attenuates microgliosis in a mouse model of Aβ amyloidosis.
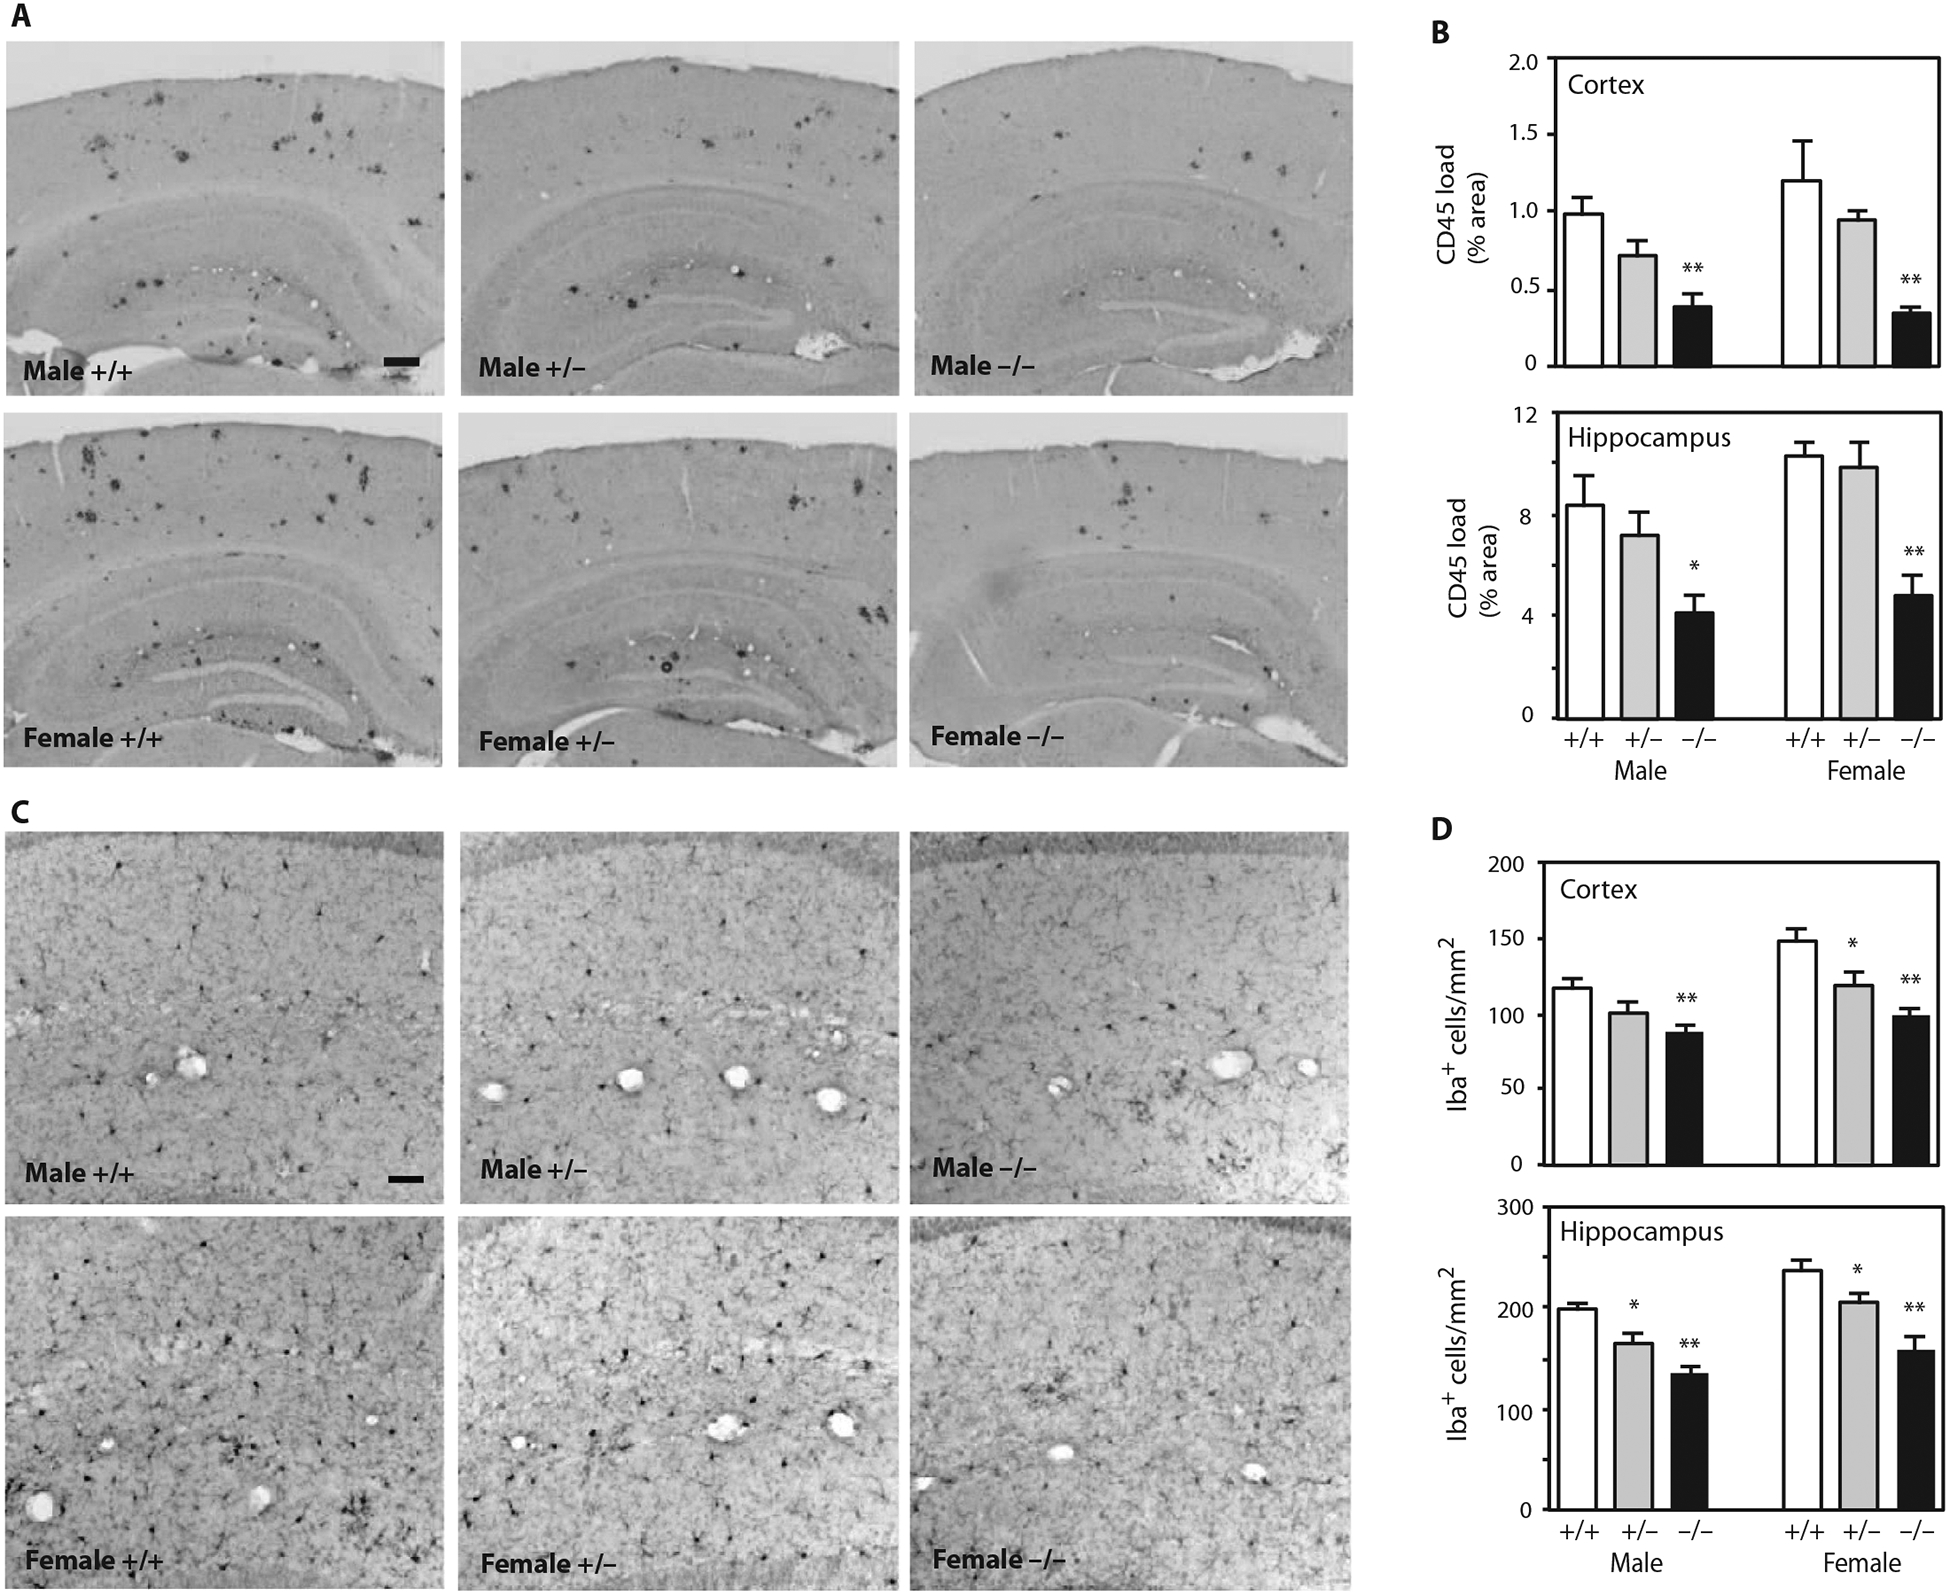
(A) Representative micrographs showing immunohistochemical staining of brain sections from APP/PS1;Idol+/+, APP/PS1;Idol+/−, or APP/PS1;Idol−/− mice with CD45 antibody. Black color indicates CD45-positive lesions. Scale bar, 200 μm. (B) Quantification of CD45 staining load in the frontal cortex or hippocampus of APP/PS1;Idol+/+, APP/PS1;Idol+/−, or APP/PS1;Idol−/− mice. Error bars represent SEM. *P < 0.05, **P < 0.01 by Student’s t test. n = 6. (C) Representative micrographs showing immunohistochemical staining of the hippocampal CA1 regions of APP/PS1;Idol+/+, APP/PS1;Idol+/−, or APP/PS1;Idol−/− mice with Iba1 antibody. Black color indicates Iba1+ cells. Scale bar, 50 μm. (D) Quantification of the number of Iba1+ cells in the frontal cortex or hippocampus of APP/ PS1;Idol+/+, APP/PS1;Idol+/−, or APP/PS1;Idol−/− mice. Error bars represent SEM. *P < 0.05, **P < 0.01 by Student’s t test. n = 6.