
Fig. 5. Idol regulates ApoE in the brain.
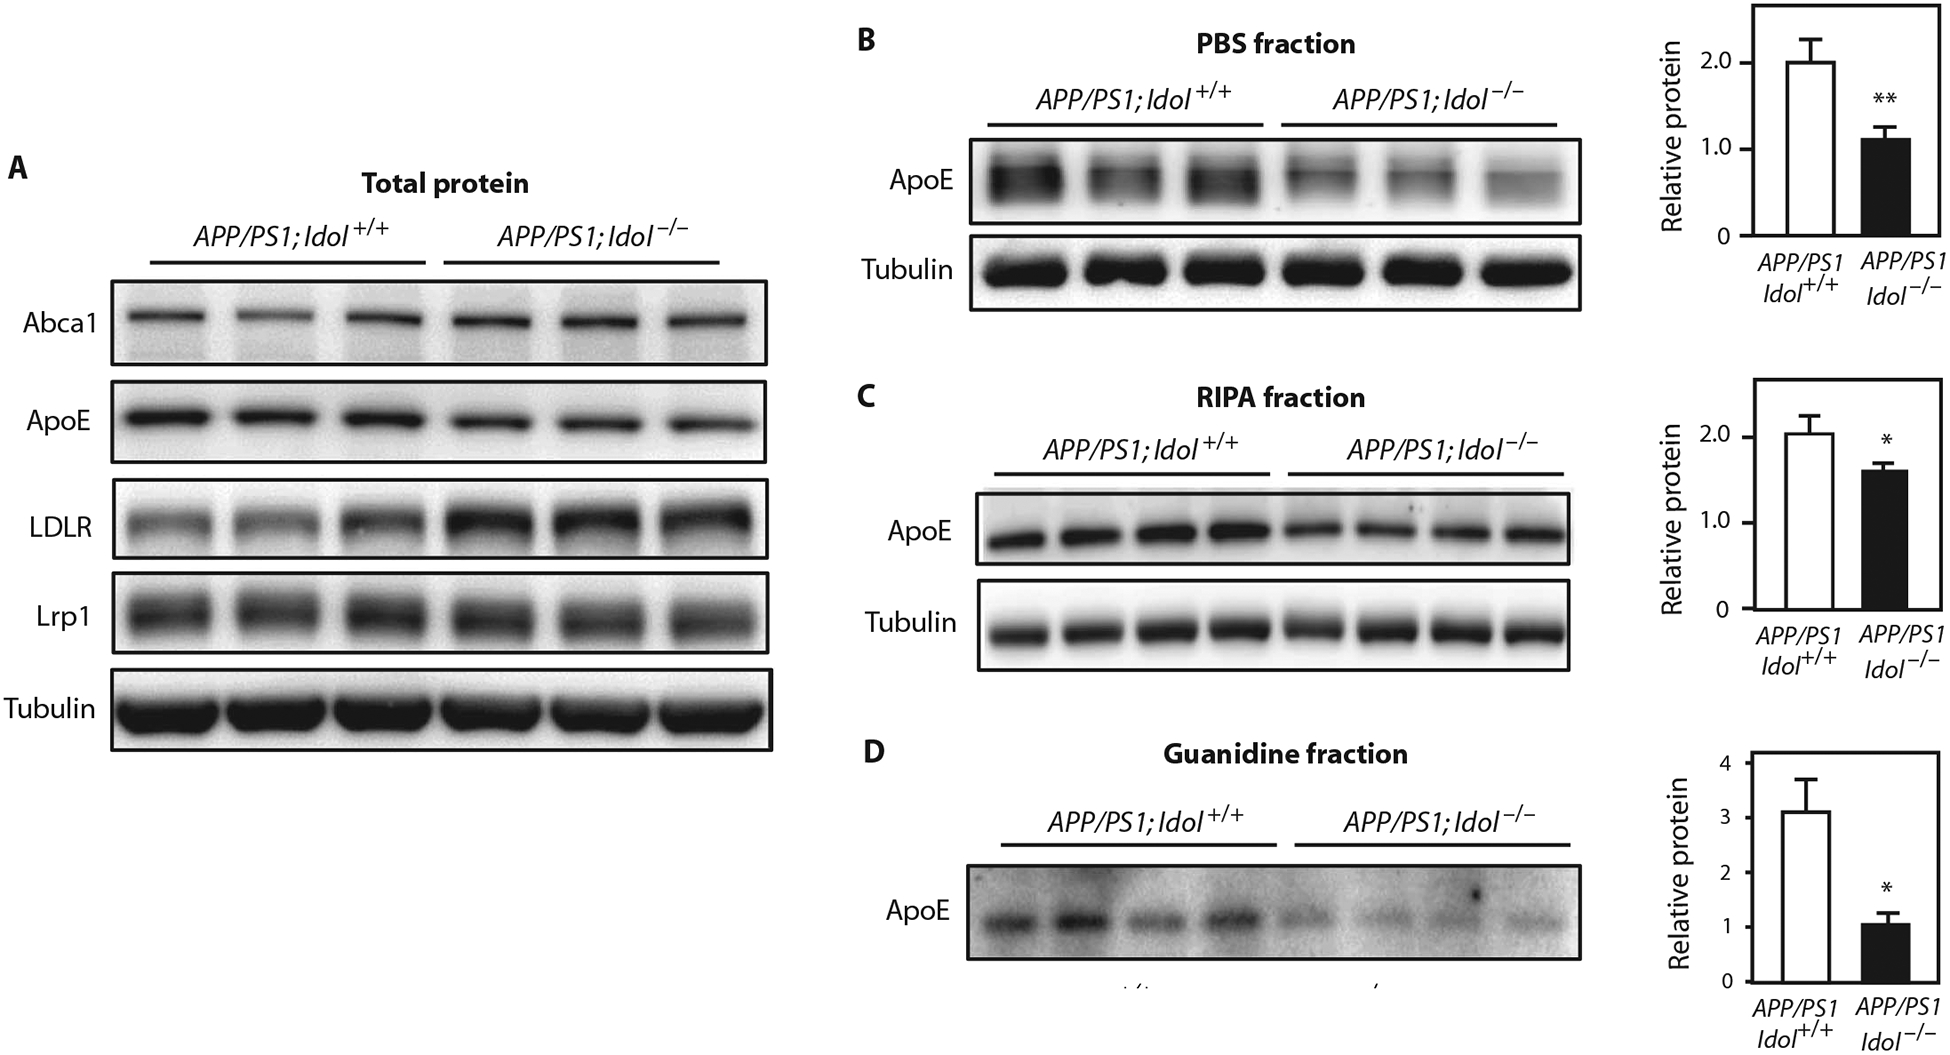
(A) Immunoblot analysis of total brain lysates from the frontal cortex of APP/PS1;Idol+/+ or APP/PS1;Idol−/− mice. Lanes represent samples from individual mice. (B to D) Immunoblot analysis of ApoE and tubulin protein in the (B) PBS-soluble fraction, (C) RIPA fraction, and (D) insoluble (guanidine) fraction from the frontal samples from individual mice. Quantification of the 0.05, **P < 0.01 by Student’s t test. Each experiment was cortex of APP/PS1;Idol+/+ or APP/PS1;Idol−/− mice. Lanes represent signals is presented on the right. Error bars represent SEM. *P < at least twice.