
Fig. 6. Idol modulates cellular Aβ uptake and Aβ clearance in brain-derived cell lines.
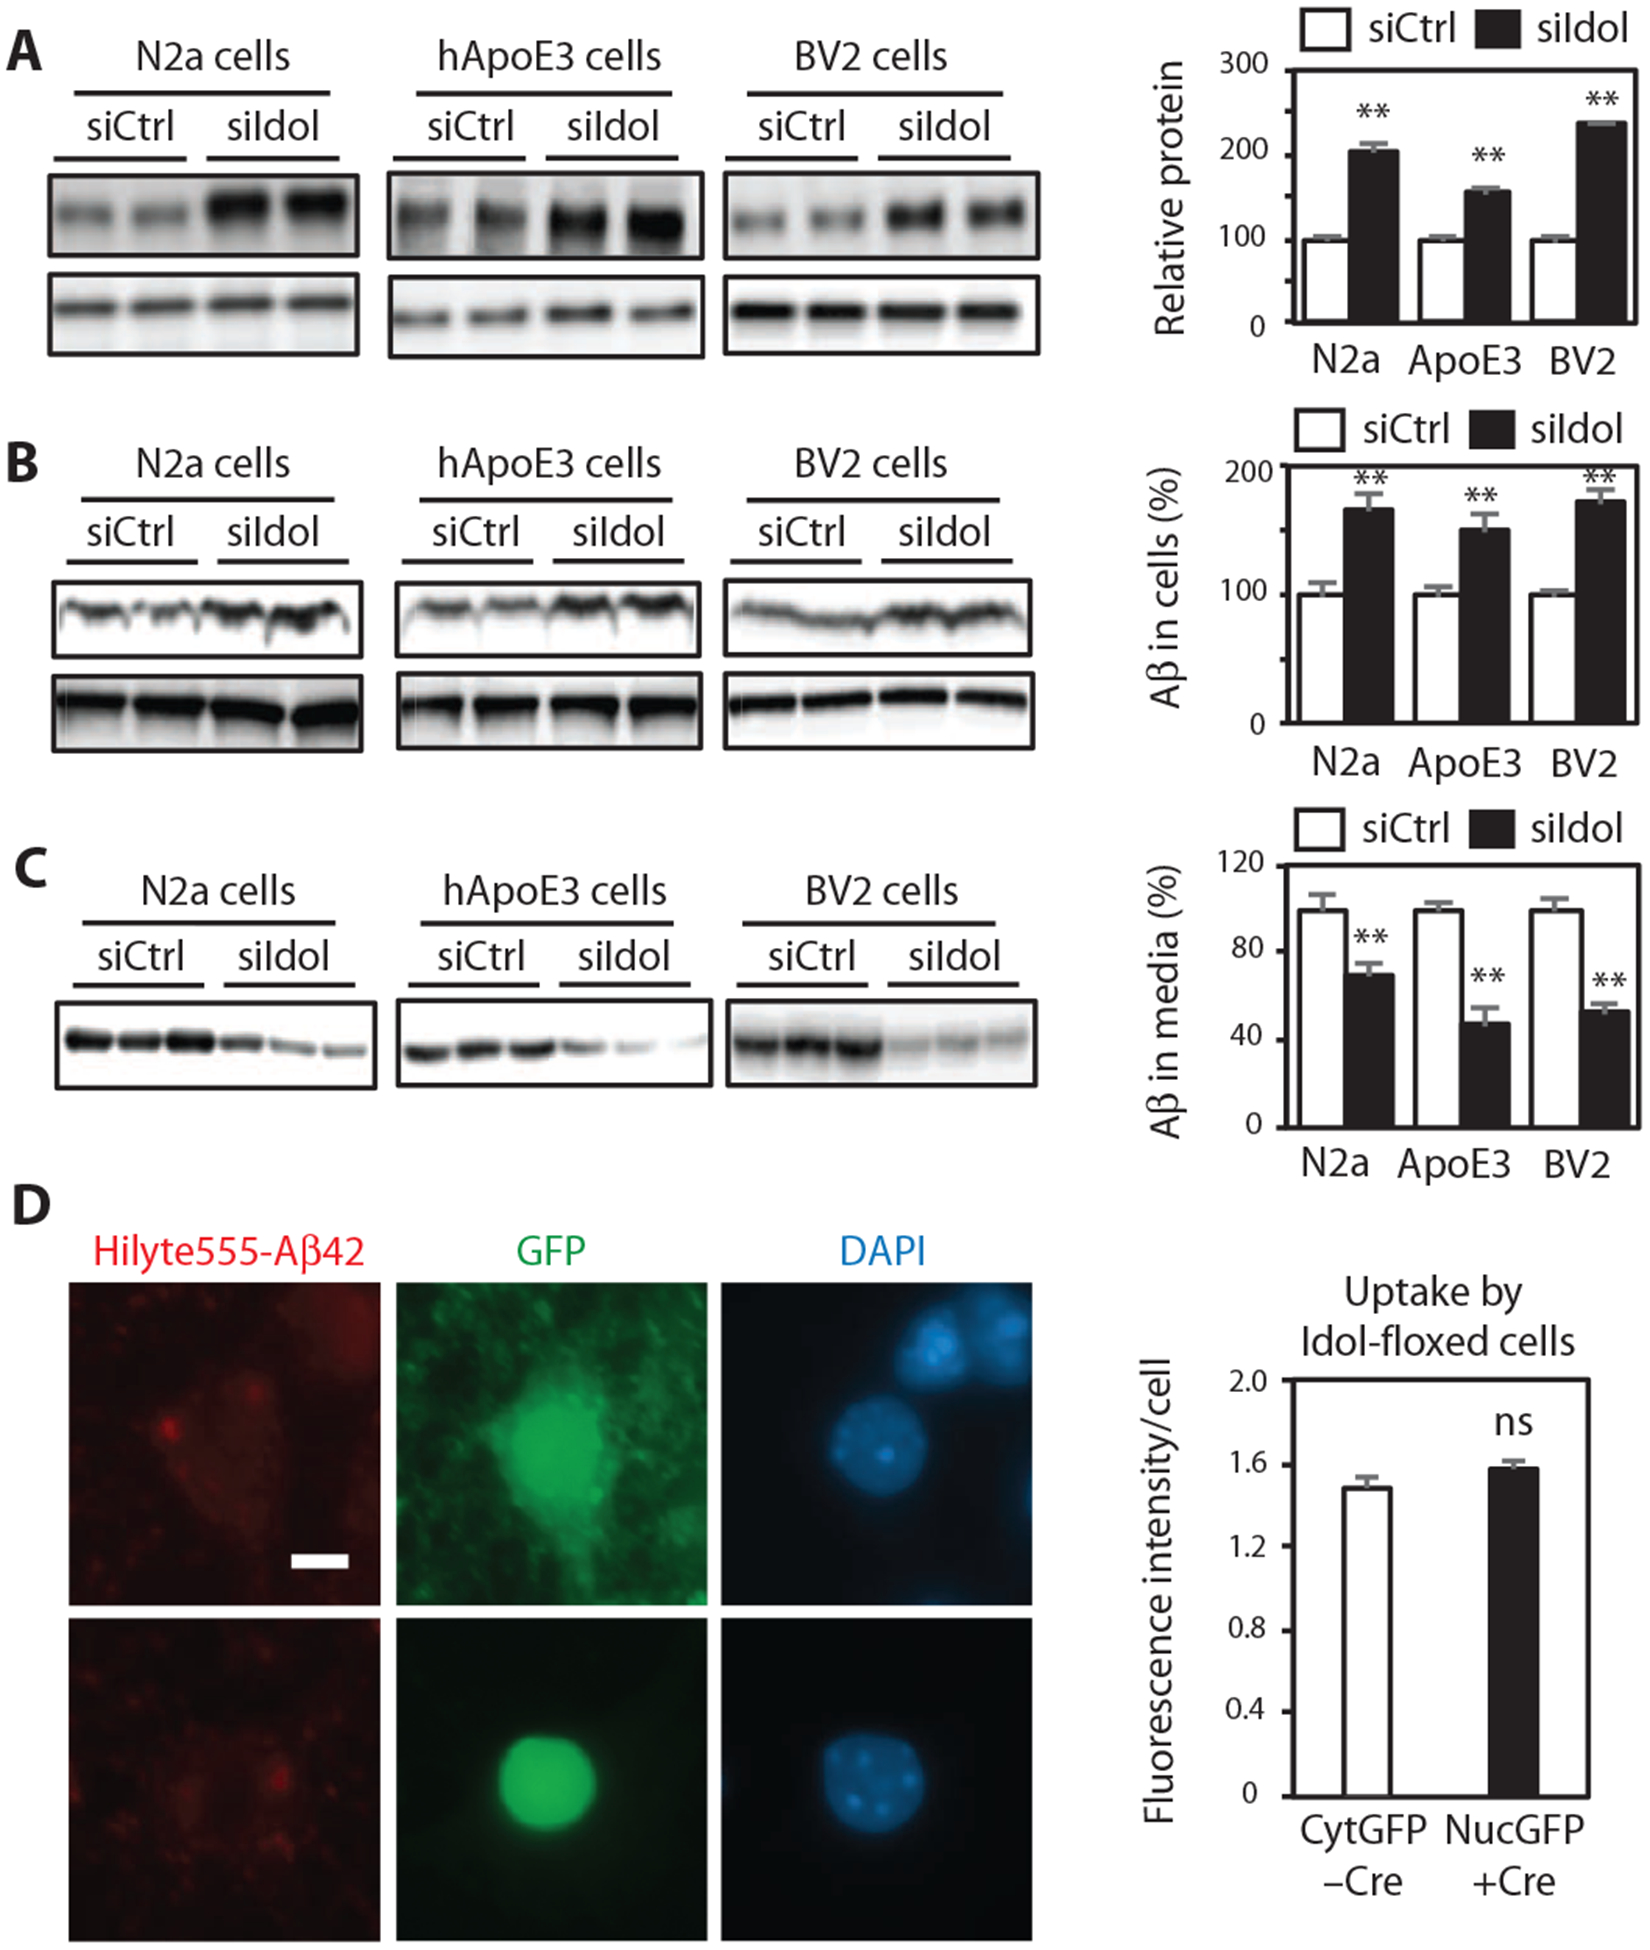
(A) Immunoblot analysis of LDLR protein in Neuro2a (N2a) cells, hApoE3 cells, and BV2 cells transfected with control or Idol-specific siRNA. Quantification of the immunoblot signals is presented on the right. Error bars represent SEM. **P < 0.01 by Student’s t test. (B) Immunoblot analysis of intracellular Aβ protein in Neuro2a cells, hApoE3 cells, and BV2 cells transfected with control or Idol-specific siRNA and then incubated for 3 hours with recombinant Aβ. Quantification of the immunoblot signals is presented on the right. Error bars represent SEM. **P < 0.01 by Student’s t test. (C) Immunoblot analysis of extracellular Aβ protein in the media of cultures of Neuro2a cells, hApoE3 cells, and BV2 cells transfected with control or Idol-specific siRNA and then incubated for 24 hours with recombinant Aβ. Quantification of the immunoblot signals is presented on the right. Error bars represent SEM. **P < 0.01 by Student’s t test. (D) Representative micrographs showing uptake of fluorescently labeled aggregated HiLyte555-Aβ42 after a 4-hour incubation in primary hippocampal neurons from Idolflox/flox mice treated in vitro with control green fluorescent protein (GFP)–expressing or GFP/Cre (fusion protein with nuclear localization signal)–expressing AAV vector. Red, Aβ42; green, GFP; blue, DAPI. Scale bar, 5 μm. GFP or GFP-Cre expression was driven from a neuron-specific calcium/calmodulin-dependent protein kinase IIa (CaMKIIa) promoter. Quantification of the fluorescence intensity is presented on the right. Error bars represent SEM. n ≥ 40. Each experiment was performed at least twice.