
Fig. 7. Idol modulates cellular Aβ and ApoE uptake by microglia.
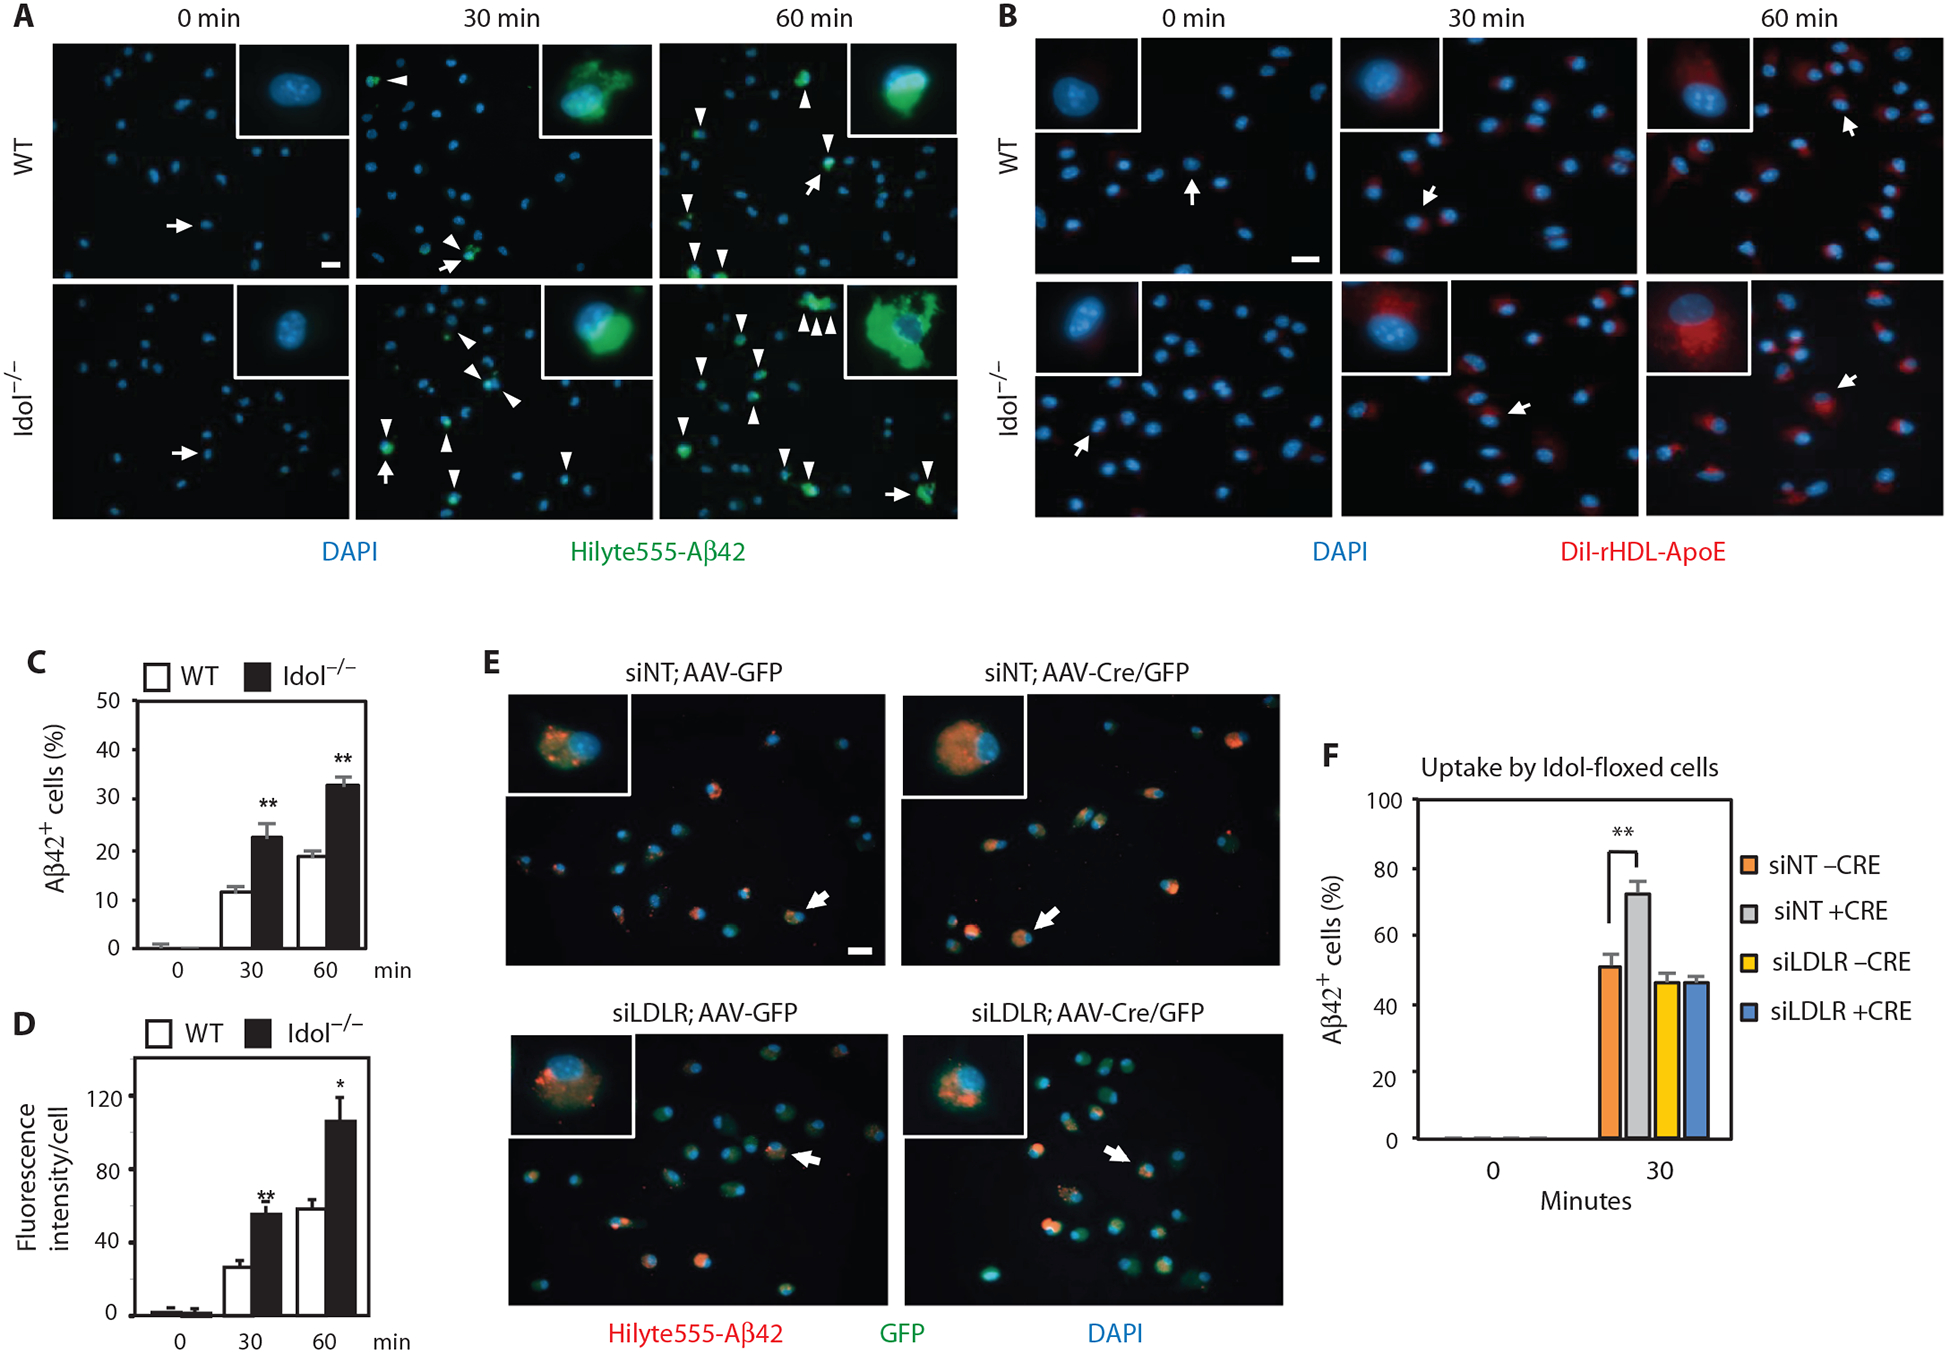
(A) Representative micrographs showing uptake of fluorescently labeled aggregated HiLyte488-Aβ42 in primary microglia from WT and Idol−/− mice. Blue, DAPI; green, Aβ42. Arrowheads denote Aβ42-positive cells. Arrows denote representative cells shown in the magnified field. Scale bar, 20 μm. (B) Representative micrographs showing uptake of 1,1′-dioctadecyl-3,3,3′,3′-tetramethylindocarbocyanine perchlorate (DiI)–labeled reconstituted discoidal HDL particles containing ApoE by primary microglia from WT and Idol−/− mice. Blue, DAPI; red, DiI rHDL-ApoE. Arrows denote representative cells shown in the magnified field. Scale bar, 20 μm. (C) Quantification of the results shown in (A). Error bars represent SEM. **P < 0.01 by Student’s t test. (D) Quantification of the results shown in (B). Error bars represent SEM. *P < 0.05, **P < 0.01 by Student’s t test. (E) Representative micrographs showing uptake of fluorescently labeled aggregated HiLyte555-Aβ42 after a 30-min incubation in primary microglia from Idolflox/flox mice infected with AAV5/CMV-GFP or AAV5/CMV-Cre/GFP and treated with Accell siRNA nontargeting control (siNT) or siRNA against mouse LDLR (siLDLR). Arrows denote representative cells shown in the magnified field. Scale bar, 20 μm. (F) Quantification of the results shown in (E). Error bars represent SEM. **P < 0.01 by Student’s t test. Each experiment was performed at least twice.