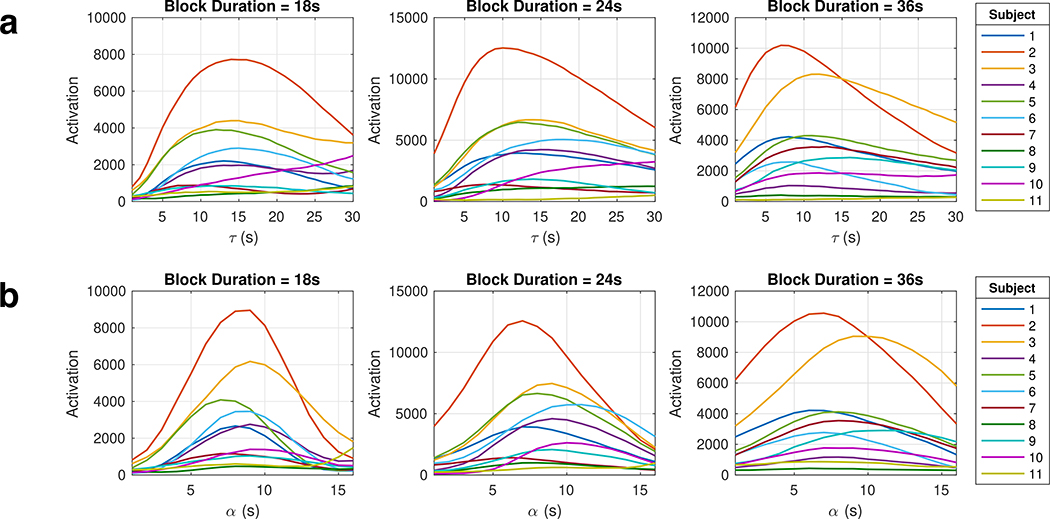
FIGURE 5.
Quantification of fMRE activation versus the regressor’s time constant τ (a) and shape parameter α (b) for each of the three block durations. The τ at which the peak of each curve occurs is the arg max of activation, τ*; similarly the α at which the peak of each curve occurs is recorded as the α*.

