
Figure 1. ZBP1 Activates MLKL in the Nucleus of IAV-Infected Cells.
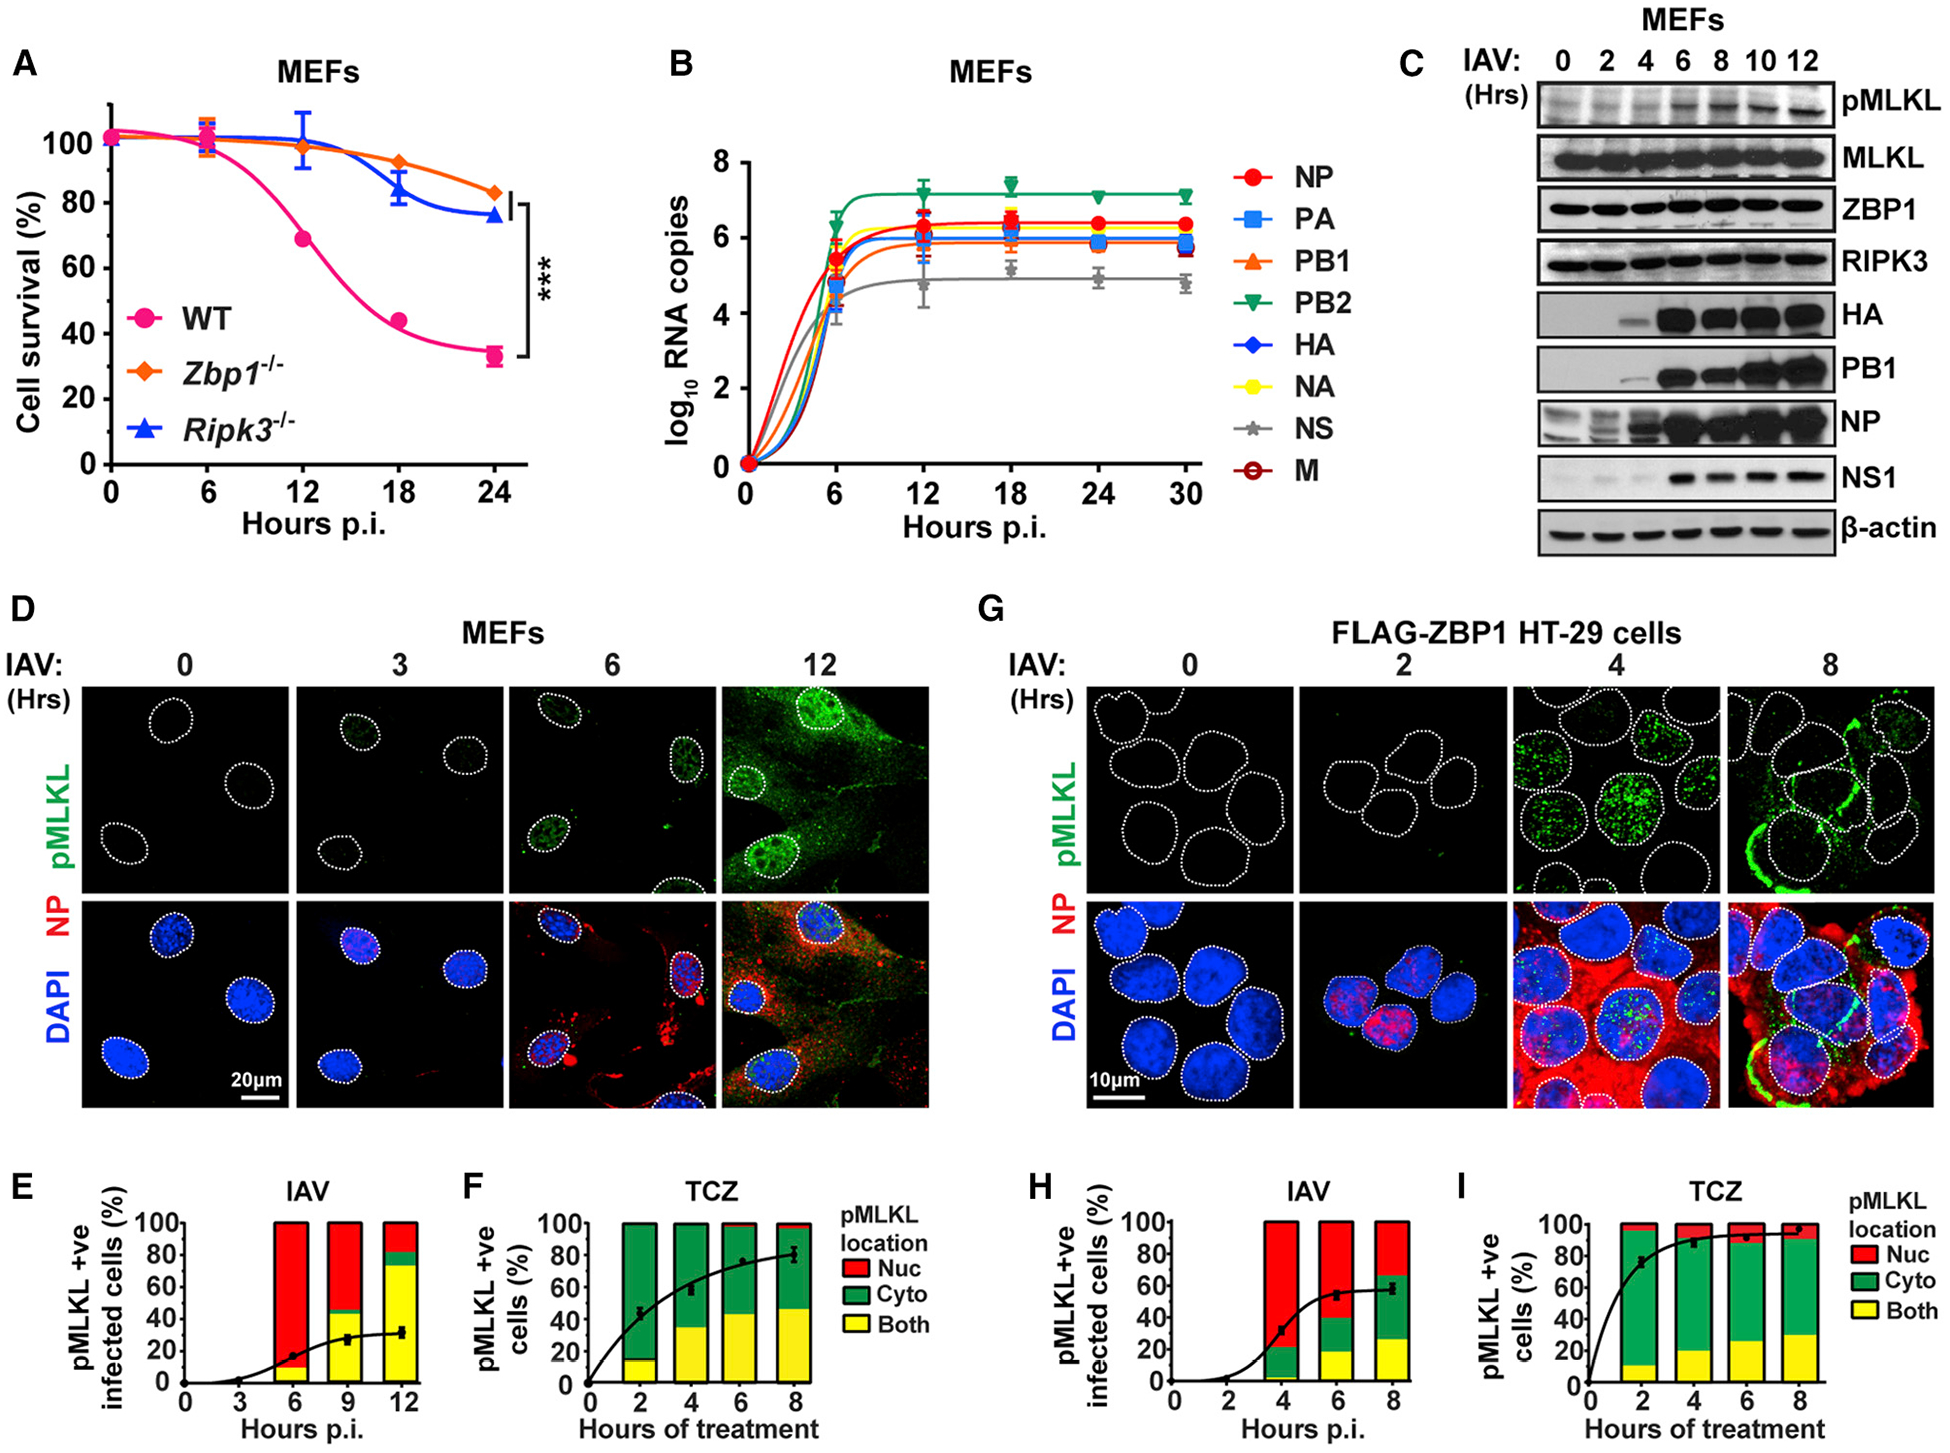
(A) IAV-induced cell death kinetics in primary wild-type (WT), Zbp1−/−, and Ripk3−/− MEFs.
(B) IAV vRNA production kinetics in infected WT MEFs.
(C) Immunoblot analysis of MLKL activation and viral protein synthesis in WT MEFs. (D) Immunofluorescence staining of IAV-infected WT MEFs for phosphorylated MLKL (green) and NP expression (red).
(E and F) Quantification of pMLKL localization in IAV-infected (E) and TCZ-treated (F) WT MEFs.
(G) Immunofluorescence staining of IAV-infected FLAG-ZBP1 expressing HT-29 cells for phosphorylated MLKL (green) and NP expression (red).
(H and I) Quantification of pMLKL localization in IAV-infected (H) and TCZ-treated (I) FLAG-ZBP1 HT-29 cells. Line graphs in (E), (F), (H), and (I) represent the kinetics of pMLKL positivity, and bar graphs show the localization of pMLKL signal. Nuclei are stained with DAPI (blue) and outlined by dashed white lines. TCZ = human or murine TNFα (50 ng/mL) + cycloheximide (250 ng/mL) + zVAD (50 μM). IAV PR8 was used at MOI = 2 in these experiments. Data are representative of at least three independent experiments. Error bars represent mean ± SD. Two-way ANOVA and Tukey’s multiple comparisons test, ***p < 0.0005. Scale bars represent 20 μm (D) and 10 μm (G).
See also Figure S1.