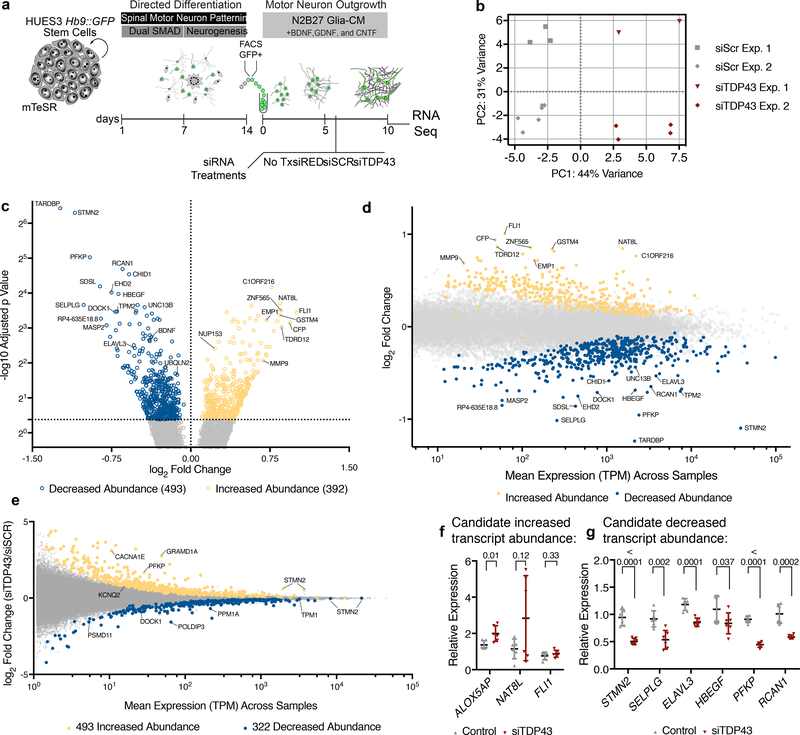
Figure 1. RNA-Seq following TDP-43 knockdown in hMNs.
(a) hMN differentiation, purification, and RNAi strategy for TDP-43 knockdown in cultured hMNs. (b) Multidimensional scaling analysis for RNA-Seq data sets obtained from n=2 independent MN differentiation and siRNA transfection experiments based on 500 most differentially expressed transcripts. (c) Volcano plot showing transcripts with significantly altered abundance in hMNs treated with siTDP43 relative to those with scrambled controls. We tested for significant differences between control (n=9) and TDP43 knockdown (n=6) samples, which are highlighted, using the Wald test and a cutoff of 0.05 for Benjamini-Hochberg adjusted p-values with no log2 fold-change ratio cutoff. (d) Differential transcript abundance scatter plot comparing TPM values for all transcripts expressed in hMNs treated with control siRNAs versus the fold change in expression for those transcripts in cells treated with siTDP43. (e) Differential exon usage scatter plot comparing TPM values for individual exons expressed in hMNs treated with siTDP43 siRNAs versus the fold change in expression for those exons in cells treated with control siRNAs. (f-g) A subset of 9 transcripts initially identified as ‘hits’ (significantly increased abundance (f) or decreased abundance (g)) in the TDP43 knockdown experiment were selected for validation by qRT-PCR. Data are displayed as mean with SD of technical replicates from n=2 independent experiments (Unpaired t-test, two-sided, P value < 0.05).

