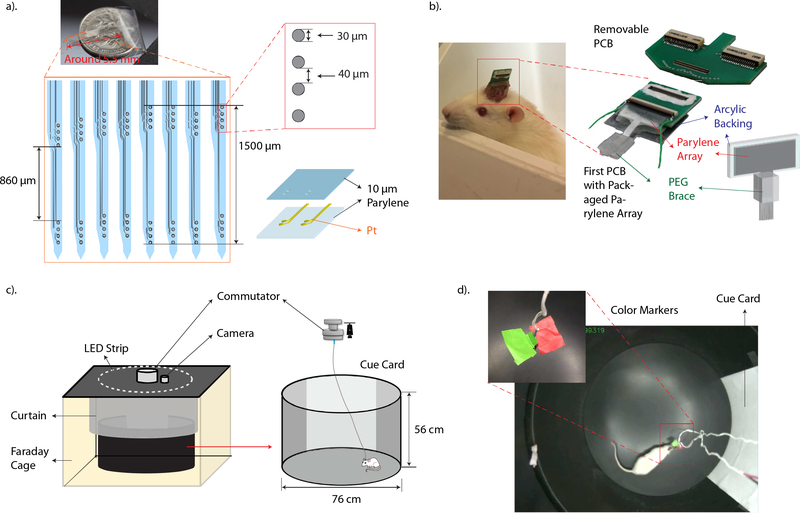
Figure 2.
a). A detailed sketch of the layout of the Parylene array. The diameter of each electrode, spacing between electrodes and 3D structure of the Parylene array are shown on the right. b). The left photo shows an animal implanted with the Parylene array with only half of the first PCB exposed for connection. Right side photos show a packaged-Parylene array attached to the first PCB and a photo of the removable, second PCB. c). Schematic representation of the recording environment and the dimension of the recording chamber. A 76 cm x 56 cm round recording chamber is placed inside a customized Faraday cage and the interior isolated from the lab environment with a black curtain. A white cue card covering ¼ of the chamber’s wall is used as a visual cue to the animal. A LED strip is placed on top of the Faraday cage to provide illumination to the recording area. A commutator is used to prevent twisting of connect cables. d). Shows a top view of the recording chamber captured with the over-head camera. The photo on top left corner shows two color tabs attached to the headstage which was affixed to the animal’s head. The tabs served as markers for the behavioral recording system to track during recording sessions.

